MoneyGram 2013 Annual Report Download - page 91
Download and view the complete annual report
Please find page 91 of the 2013 MoneyGram annual report below. You can navigate through the pages in the report by either clicking on the pages listed below, or by using the keyword search tool below to find specific information within the annual report.-
 1
1 -
2
-
3
-
4
-
5
-
6
-
7
-
8
-
9
-
10
-
11
-
12
-
13
-
14
-
15
-
16
-
17
-
18
-
19
-
20
-
21
-
22
-
23
-
24
-
25
-
26
-
27
-
28
-
29
-
30
-
31
-
32
-
33
-
34
-
35
-
36
-
37
-
38
-
39
-
40
-
41
-
42
-
43
-
44
-
45
-
46
-
47
-
48
-
49
-
50
-
51
-
52
-
53
-
54
-
55
-
56
-
57
-
58
-
59
-
60
-
61
-
62
-
63
-
64
-
65
-
66
-
67
-
68
-
69
-
70
-
71
-
72
-
73
-
74
-
75
-
76
-
77
-
78
-
79
-
80
-
 81
81 -
 82
82 -
 83
83 -
 84
84 -
 85
85 -
 86
86 -
 87
87 -
 88
88 -
 89
89 -
 90
90 -
 91
91 -
 92
92 -
 93
93 -
 94
94 -
 95
95 -
 96
96 -
 97
97 -
 98
98 -
 99
99 -
 100
100 -
 101
101 -
102
-
103
-
104
-
105
-
106
-
107
-
108
-
109
-
110
-
111
-
112
-
113
-
114
-
115
-
116
-
117
-
118
-
119
-
120
-
121
-
122
-
123
-
124
-
125
-
126
-
127
-
128
-
129
-
130
-
131
-
132
-
133
-
134
-
135
-
136
-
137
-
138
 |
 |
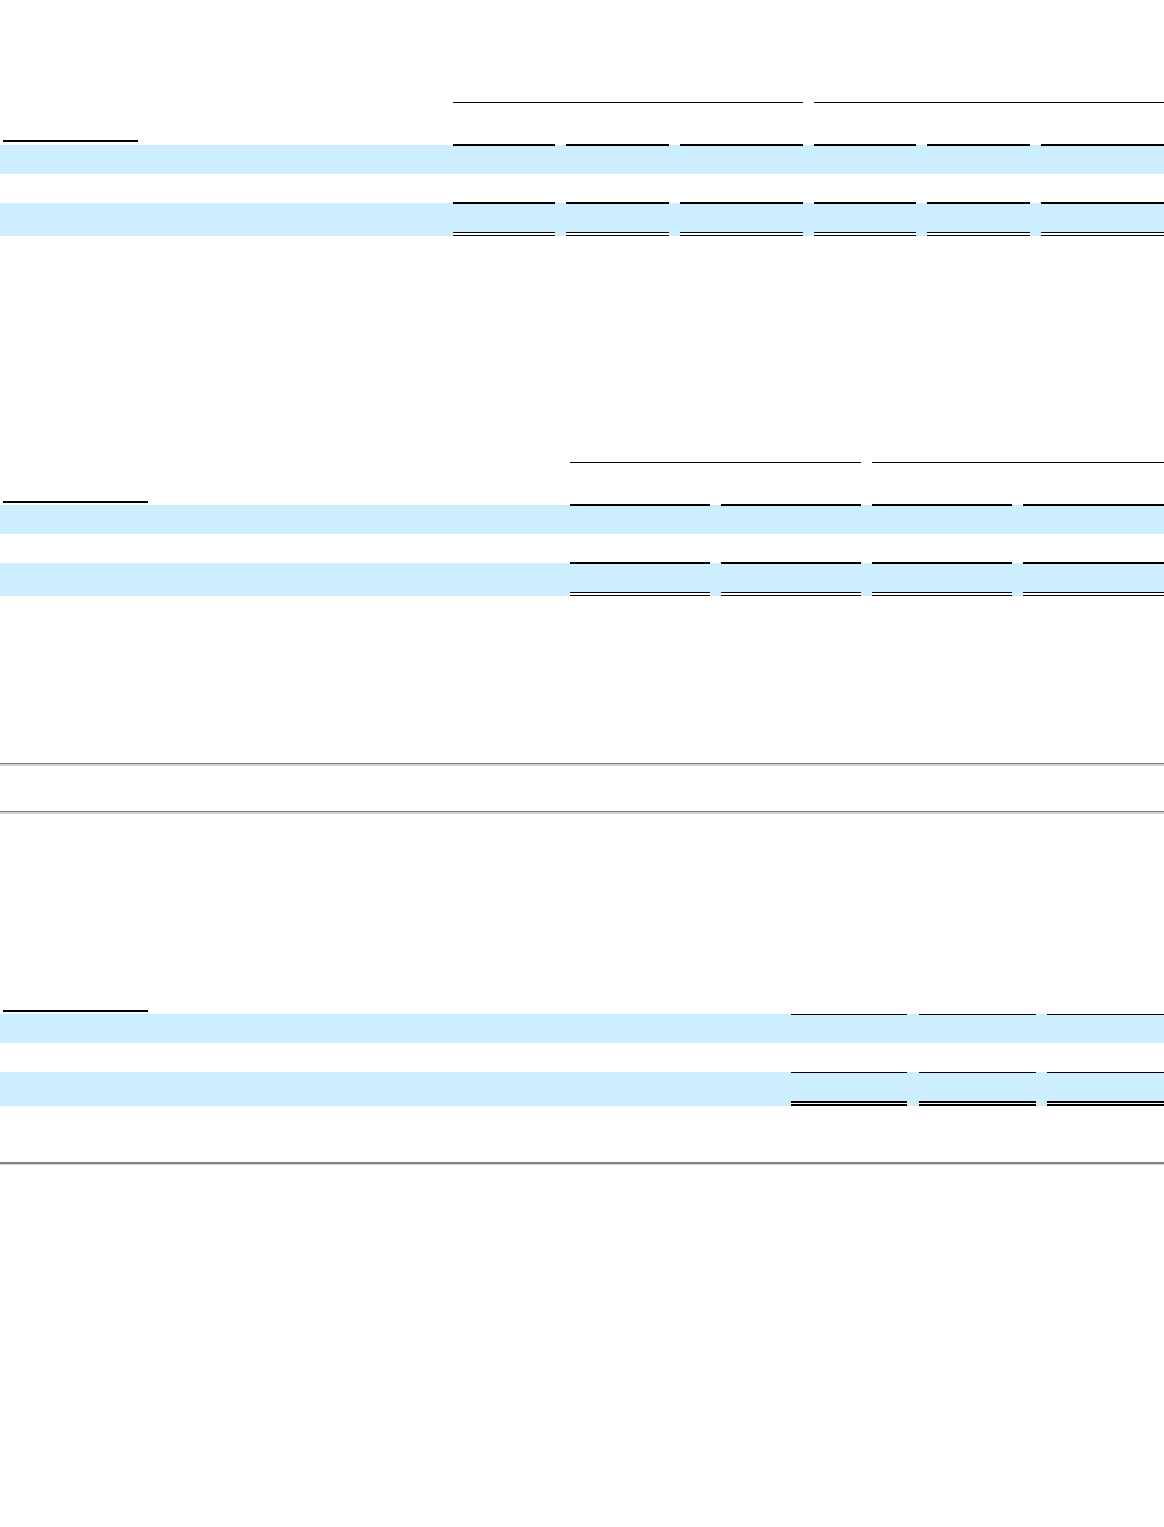
Table of Contents
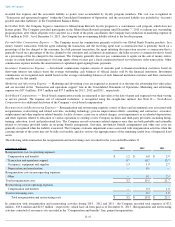
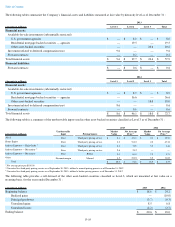
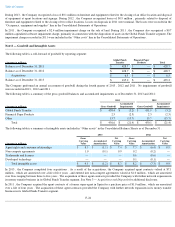
Had the Company used the lowest rating from the rating agencies in the information presented above, there would be $3.4 million and a
nominal
change to investments rated A or better as of December 31, 2013 and 2012 , respectively.
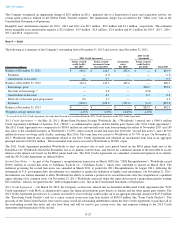
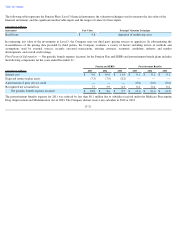
Contractual Maturities —
Actual maturities may differ from contractual maturities as borrowers may have the right to call or prepay
obligations, sometimes without call or prepayment penalties. Maturities of mortgage-backed and other asset-
backed securities depend on the
repayment characteristics and experience of the underlying obligations.
The following is a summary of amortized cost and fair value of
available-for-sale of securities by contractual maturity as of December 31 :
Fair Value Determination
— The Company uses various sources of pricing for its fair value estimates of its available-for-
sale portfolio. The
percentage of the portfolio for which the various pricing sources were used is as follows at December 31, 2013 and 2012 : 64 percent and
60
percent , respectively, used a third party pricing service; 10 percent and 12 percent , respectively, used broker pricing; and 26 percent and
28
percent , respectively, used internal pricing.
Assessment of Unrealized Losses
— The Company had no unrealized losses in its available-for-sale portfolio at December 31, 2013 and 2012 .
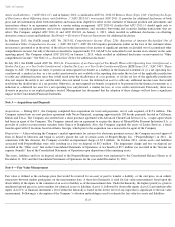
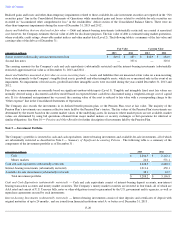
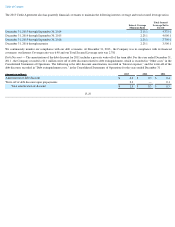
Note 6 — Derivative Financial Instruments
The Company uses forward contracts to manage its foreign currency needs and foreign currency exchange risk arising from its assets and
liabilities denominated in foreign currencies. While these contracts may mitigate certain foreign currency risk, they are not designated as hedges
for accounting purposes. The “Transaction and operations support”
line in the Consolidated Statements of Operations and the "Net cash provided
by (used in) operating activities" line in the Consolidated Statements of Cash Flows include the following (gains) losses related to assets and
liabilities denominated in foreign currencies, for the years ended December 31 :
F-22
2013
2012
(Dollars in millions) Number of
Securities
Fair
Value
Percent of
Investments
Number of
Securities
Fair
Value
Percent of
Investments
Investment grade
16
$
30.8
64
%
20
$
45.3
71
%
Below investment grade
50
17.3
36
%
54
18.2
29
%
Total
66
$
48.1
100
%
74
$
63.5
100
%
2013
2012
(Amounts in millions) Amortized
Cost
Fair
Value
Amortized
Cost
Fair
Value
After one year through five years
$
7.7
$
8.0
$
8.2
$
8.9
Mortgage-backed and other asset-backed securities
23.7
40.1
41.1
54.6
Total
$
31.4
$
48.1
$
49.3
$
63.5
(Amounts in millions) 2013
2012
2011
Net realized foreign currency (gains) losses
$
(3.3
)
$
(2.8
)
$
2.9
Net losses from the related forward contracts
5.3
5.8
5.8
Net losses from foreign currency transactions and related forward contracts
$
2.0
$
3.0
$
8.7