MoneyGram 2013 Annual Report Download - page 29
Download and view the complete annual report
Please find page 29 of the 2013 MoneyGram annual report below. You can navigate through the pages in the report by either clicking on the pages listed below, or by using the keyword search tool below to find specific information within the annual report.-
 1
1 -
2
-
3
-
4
-
5
-
6
-
7
-
8
-
9
-
10
-
11
-
12
-
13
-
14
-
15
-
16
-
17
-
18
-
 19
19 -
 20
20 -
 21
21 -
 22
22 -
 23
23 -
 24
24 -
 25
25 -
 26
26 -
 27
27 -
 28
28 -
 29
29 -
 30
30 -
 31
31 -
 32
32 -
 33
33 -
 34
34 -
 35
35 -
 36
36 -
 37
37 -
 38
38 -
 39
39 -
40
-
41
-
42
-
43
-
44
-
45
-
46
-
47
-
48
-
49
-
50
-
51
-
52
-
53
-
54
-
55
-
56
-
57
-
58
-
59
-
60
-
61
-
62
-
63
-
64
-
65
-
66
-
67
-
68
-
69
-
70
-
71
-
72
-
73
-
74
-
75
-
76
-
77
-
78
-
79
-
80
-
81
-
82
-
83
-
84
-
85
-
86
-
87
-
88
-
89
-
90
-
91
-
92
-
93
-
94
-
95
-
96
-
97
-
98
-
99
-
100
-
101
-
102
-
103
-
104
-
105
-
106
-
107
-
108
-
109
-
110
-
111
-
112
-
113
-
114
-
115
-
116
-
117
-
118
-
119
-
120
-
121
-
122
-
123
-
124
-
125
-
126
-
127
-
128
-
129
-
130
-
131
-
132
-
133
-
134
-
135
-
136
-
137
-
138
 |
 |

Table of Contents
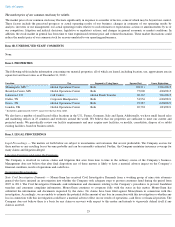
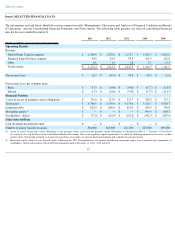
Item 6. SELECTED FINANCIAL DATA
The information set forth below should be read in conjunction with “Management’
s Discussion and Analysis of Financial Condition and Results
of Operations”
and our Consolidated Financial Statements and Notes thereto. The following table presents our selected consolidated financial
data for the years ended December 31 :
27
2013
2012
2011
2010
2009
(Dollars in millions, except per share and location data)
Operating Results
Revenue
Global Funds Transfer segment
$
1,389.8
$
1,255.2
$
1,152.7
$
1,053.3
$
1,025.4
Financial Paper Products segment
84.0
84.5
93.3
109.5
122.8
Other
0.6
1.5
1.8
3.9
13.5
Total revenue
$
1,474.4
$
1,341.2
$
1,247.8
$
1,166.7
$
1,161.7
Net income (loss)
$
52.4
$
(49.3
)
$
59.4
$
43.8
$
(1.9
)
Net income (loss) per common share:
Basic
$
0.73
$
(0.69
)
$
(9.03
)
$
(8.77
)
$
(11.87
)
Diluted
$
0.73
$
(0.69
)
$
(9.03
)
$
(8.77
)
$
(11.87
)
Financial Position
Assets in excess of payment service obligations
(1)
$
318.8
$
227.9
$
211.7
$
230.2
$
313.3
Total assets
$
4,786.9
$
5,150.6
$
5,175.6
$
5,115.7
$
5,929.7
Long-term debt
$
842.9
$
809.9
$
810.9
$
639.9
$
796.8
Mezzanine equity
(2)
$
—
$
—
$
—
$
999.4
$
864.3
Stockholders’ deficit
$
(77.0
)
$
(161.4
)
$
(110.2
)
$
(942.5
)
$
(883.0
)
Other Selected Data
Cash dividends declared per share
$
—
$
—
$
—
$
—
$
—
Number of money transfer locations
336,000
310,000
267,000
227,000
190,000
(1) Assets in excess of payment service obligations is our payment service assets less our payment service obligations as calculated in Note 2 —
Summary of Significant
Accounting Policies
of the Notes to the Consolidated Financial Statements. Due to our regulatory capital requirements, we deem the following payment service assets, in their
entirety, to be substantially restricted: cash and cash equivalents, receivables, net, interest-bearing investments and available-for-sale investments.
(2)
Mezzanine equity related to our Series B Stock. Following the 2011 Recapitalization, all amounts included in mezzanine equity were converted into components of
stockholders’ deficit and no shares of Series B Stock remained issued at December 31, 2013 , 2012 and 2011 .