MoneyGram 2013 Annual Report Download - page 77
Download and view the complete annual report
Please find page 77 of the 2013 MoneyGram annual report below. You can navigate through the pages in the report by either clicking on the pages listed below, or by using the keyword search tool below to find specific information within the annual report.-
 1
1 -
2
-
3
-
4
-
5
-
6
-
7
-
8
-
9
-
10
-
11
-
12
-
13
-
14
-
15
-
16
-
17
-
18
-
19
-
20
-
21
-
22
-
23
-
24
-
25
-
26
-
27
-
28
-
29
-
30
-
31
-
32
-
33
-
34
-
35
-
36
-
37
-
38
-
39
-
40
-
41
-
42
-
43
-
44
-
45
-
46
-
47
-
48
-
49
-
50
-
51
-
52
-
53
-
54
-
55
-
56
-
57
-
58
-
59
-
60
-
61
-
62
-
63
-
64
-
65
-
66
-
 67
67 -
 68
68 -
 69
69 -
 70
70 -
 71
71 -
 72
72 -
 73
73 -
 74
74 -
 75
75 -
 76
76 -
 77
77 -
 78
78 -
 79
79 -
 80
80 -
 81
81 -
 82
82 -
 83
83 -
 84
84 -
 85
85 -
 86
86 -
 87
87 -
88
-
89
-
90
-
91
-
92
-
93
-
94
-
95
-
96
-
97
-
98
-
99
-
100
-
101
-
102
-
103
-
104
-
105
-
106
-
107
-
108
-
109
-
110
-
111
-
112
-
113
-
114
-
115
-
116
-
117
-
118
-
119
-
120
-
121
-
122
-
123
-
124
-
125
-
126
-
127
-
128
-
129
-
130
-
131
-
132
-
133
-
134
-
135
-
136
-
137
-
138
 |
 |

Table of Contents
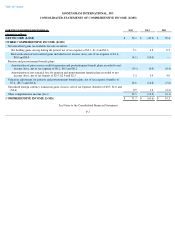
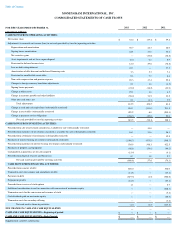
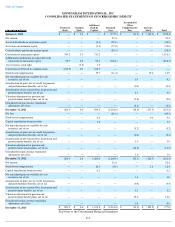
MONEYGRAM INTERNATIONAL, INC.
CONSOLIDATED STATEMENTS OF STOCKHOLDERS’ DEFICIT
See Notes to the Consolidated Financial Statements
F-9
(Amounts in millions) Preferred
Stock
Common
Stock
Additional
Paid-In
Capital
Retained
Loss
Accumulated
Other
Comprehensive
Loss
Treasury
Stock
Total
January 1, 2011
$
—
$
0.9
$
—
$
(
771.5
)
$
(31.9
)
$
(139.9
)
$
(942.4
)
Net income
—
—
—
59.4
—
—
59.4
Accrued dividends on mezzanine equity
—
—
(
2.1
)
(28.8
)
—
—
(
30.9
)
Accretion on mezzanine equity
—
—
(
1.6
)
(77.0
)
—
—
(
78.6
)
Cash dividends paid on mezzanine equity
—
—
—
(
20.5
)
—
—
(
20.5
)
Conversion of mezzanine equity
394.2
2.9
713.2
—
—
—
1,110.3
Additional consideration in connection with
conversion of mezzanine equity
52.7
0.2
95.6
(366.8
)
—
—
(
218.3
)
1 for 8 reverse stock split
—
(
3.5
)
3.5
—
—
—
—
Conversion of D Stock to common stock
(165.0
)
0.1
164.9
—
—
—
—
Stock-based compensation
—
—
15.7
(11.4
)
—
12.6
16.9
Net unrealized gain on available-for-sale
securities, net of tax
—
—
—
—
0.3
—
0.3
Amortization of prior service credit for pension
and postretirement benefits, net of tax
—
—
—
—
(
0.4
)
—
(
0.4
)
Amortization of net actuarial loss for pension and
postretirement benefits, net of tax
—
—
—
—
4.0
—
4.0
Valuation adjustment for pension and
postretirement benefit plans, net of tax
—
—
—
—
(
5.8
)
—
(
5.8
)
Unrealized foreign currency translation
adjustment, net of tax
—
—
—
—
(
4.2
)
—
(
4.2
)
December 31, 2011
281.9
0.6
989.2
(1,216.6
)
(38.0
)
(127.3
)
(110.2
)
Net loss
—
—
—
(
49.3
)
—
—
(
49.3
)
Stock-based compensation
—
—
8.6
—
—
0.6
9.2
Capital contribution from investors
—
—
3.2
—
—
—
3.2
Net unrealized gain on available-for-sale
securities, net of tax
—
—
—
—
(
5.2
)
—
(
5.2
)
Amortization of prior service credit for pension
and postretirement benefits, net of tax
—
—
—
—
(
0.4
)
—
(
0.4
)
Amortization of net actuarial loss for pension and
postretirement benefits, net of tax
—
—
—
—
3.9
—
3.9
Valuation adjustment for pension and
postretirement benefit plans, net of tax
—
—
—
—
(
14.2
)
—
(
14.2
)
Unrealized foreign currency translation
adjustment, net of tax
—
—
—
—
1.6
—
1.6
December 31, 2012
281.9
0.6
1,001.0
(1,265.9
)
(52.3
)
(126.7
)
(161.4
)
Net income
—
—
—
52.4
—
—
52.4
Stock-based compensation
—
—
10.5
(0.9
)
—
2.8
12.4
Capital contribution from investors
—
—
0.3
—
—
—
0.3
Net unrealized gain on available-for-sale
securities, net of tax
—
—
—
—
1.0
—
1.0
Amortization of prior service credit for pension
and postretirement benefits, net of tax
—
—
—
—
(
0.4
)
—
(
0.4
)
Amortization of net actuarial loss for pension and
postretirement benefits, net of tax
—
—
—
—
5.2
—
5.2
Valuation adjustment for pension and
postretirement benefit plans, net of tax
—
—
—
—
12.6
—
12.6
Unrealized foreign currency translation
adjustment, net of tax
—
—
—
—
0.9
—
0.9
December 31, 2013
$
281.9
$
0.6
$
1,011.8
$
(1,214.4
)
$
(33.0
)
$
(123.9
)
$
(77.0
)