MoneyGram 2013 Annual Report Download - page 55
Download and view the complete annual report
Please find page 55 of the 2013 MoneyGram annual report below. You can navigate through the pages in the report by either clicking on the pages listed below, or by using the keyword search tool below to find specific information within the annual report.-
 1
1 -
2
-
3
-
4
-
5
-
6
-
7
-
8
-
9
-
10
-
11
-
12
-
13
-
14
-
15
-
16
-
17
-
18
-
19
-
20
-
21
-
22
-
23
-
24
-
25
-
26
-
27
-
28
-
29
-
30
-
31
-
32
-
33
-
34
-
35
-
36
-
37
-
38
-
39
-
40
-
41
-
42
-
43
-
44
-
 45
45 -
 46
46 -
 47
47 -
 48
48 -
 49
49 -
 50
50 -
 51
51 -
 52
52 -
 53
53 -
 54
54 -
 55
55 -
 56
56 -
 57
57 -
 58
58 -
 59
59 -
 60
60 -
 61
61 -
 62
62 -
 63
63 -
 64
64 -
 65
65 -
66
-
67
-
68
-
69
-
70
-
71
-
72
-
73
-
74
-
75
-
76
-
77
-
78
-
79
-
80
-
81
-
82
-
83
-
84
-
85
-
86
-
87
-
88
-
89
-
90
-
91
-
92
-
93
-
94
-
95
-
96
-
97
-
98
-
99
-
100
-
101
-
102
-
103
-
104
-
105
-
106
-
107
-
108
-
109
-
110
-
111
-
112
-
113
-
114
-
115
-
116
-
117
-
118
-
119
-
120
-
121
-
122
-
123
-
124
-
125
-
126
-
127
-
128
-
129
-
130
-
131
-
132
-
133
-
134
-
135
-
136
-
137
-
138
 |
 |

Table of Contents
The following is a discussion of the risks we have deemed most critical to our business and the strategies we use to manage and mitigate such
risks. While containing forward-
looking statements related to risks and uncertainties, this discussion and related analyses are not predictions of
future events. Our actual results could differ materially from those anticipated due to various factors discussed under “
Cautionary Statements
Regarding Forward
-Looking Statements ” and under “ Risk Factors ” in Part 1, Item 1A of this Annual Report on Form 10-K.
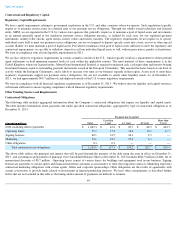
Credit Risk
Credit risk, or the potential risk that we may not collect amounts owed to us, affects our business primarily through receivables, investments and
derivative financial instruments. In addition, the concentration of our cash, cash equivalents and investments at large financial institutions
exposes us to credit risk.
Investment Portfolio
—
Credit risk from our investment portfolio relates to the risk that we may be unable to collect the interest or principal
owed to us under the legal terms of the various securities. Our primary exposure to credit risk arises through the concentration of a large amount
of our investment portfolio at a few large banks, also referred to as financial institution risk, as well as a concentration in securities issued by, or
collateralized by, U.S. government agencies.
At December 31, 2013 , the Company’s investment portfolio of $3.3 billion
was primarily comprised of cash, U.S. government securities, bank
deposits and bank time deposits. Based on investment policy restrictions, investments are limited to U.S. government securities and securities of
agencies of the U.S. government, certificates of deposit and time deposits with banks with minimum debt ratings of A3 (Moody’s) and A-
(S&P), commercial paper with minimum ratings of A-1 (Moody’s) and P-
1 (S&P) and U.S. dollar denominated SEC registered senior notes of
corporations with minimum ratings of A3 and A-. No maturity in the portfolio exceeds 24 months from the date of purchase.
The financial institutions holding significant portions of our investment portfolio may act as custodians for our asset accounts, serve as
counterparties to our foreign currency transactions and conduct cash transfers on our behalf for the purpose of clearing our payment instruments
and related agent receivables and agent payables. Through certain check clearing agreements and other contracts, we are required to utilize
several of these financial institutions.
The concentration in U.S. government agencies includes agencies placed under conservatorship by the U.S. government in 2008 and extended
unlimited lines of credit from the U.S. Treasury. The implicit guarantee of the U.S. government and its actions to date support our belief that the
U.S. government will honor the obligations of its agencies if the agencies are unable to do so themselves.
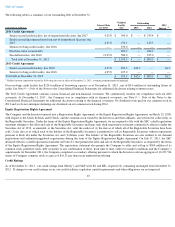
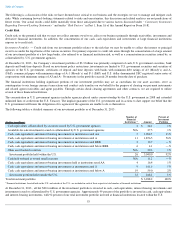
The following table is a detailed summary of our investment portfolio as of December 31, 2013 :
(1)
Financial institutions, located both in the U.S. and outside of the U.S., are included in each of their respective total number of financial institutions.
At December 31, 2013 , all but $20.6 million of the investment portfolio is invested in cash, cash equivalents, interest-
bearing investments and
investments issued or collateralized by U.S. government agencies. Approximately 99 percent
of the portfolio is invested in cash, cash equivalents
and interest-bearing investments, with 92 percent of our total investment portfolio invested at financial institutions located within the U.S.
53
(Dollars in millions)
Number of
Financial
Institutions
(1)
Amount
Percent of
Investment
Portfolio
Cash equivalents collateralized by securities issued by U.S. government agencies
2
$
24.1
1
%
Available-for-sale investments issued or collateralized by U.S. government agencies
N/A
27.5
1
%
Cash, cash equivalents and interest-bearing investments at institutions rated AA
5
1,094.5
33
%
Cash, cash equivalents and interest-bearing investments at institutions rated A
11
1,856.5
56
%
Cash, cash equivalents and interest-bearing investments at institutions rated BBB
2
12.7
—
%
Cash, cash equivalents and interest-bearing investments at institutions rated below BBB
6
4.1
—
%
Other asset-backed securities
N/A
20.6
1
%
Investment portfolio held within the U.S.
26
3,040.0
92
%
Cash held on-hand at owned retail locations
N/A
11.2
—
%
Cash, cash equivalents and interest-bearing investments held at institutions rated AA
4
16.4
1
%
Cash, cash equivalents and interest-bearing investments at institutions rated A
9
161.6
5
%
Cash, cash equivalents and interest-bearing investments at institutions rated below A
19
59.0
2
%
Investment portfolio held outside the U.S.
32
248.2
8
%
Total investment portfolio
$
3,288.2
100
%