MoneyGram 2013 Annual Report Download - page 34
Download and view the complete annual report
Please find page 34 of the 2013 MoneyGram annual report below. You can navigate through the pages in the report by either clicking on the pages listed below, or by using the keyword search tool below to find specific information within the annual report.-
 1
1 -
2
-
3
-
4
-
5
-
6
-
7
-
8
-
9
-
10
-
11
-
12
-
13
-
14
-
15
-
16
-
17
-
18
-
19
-
20
-
21
-
22
-
23
-
 24
24 -
 25
25 -
 26
26 -
 27
27 -
 28
28 -
 29
29 -
 30
30 -
 31
31 -
 32
32 -
 33
33 -
 34
34 -
 35
35 -
 36
36 -
 37
37 -
 38
38 -
 39
39 -
 40
40 -
 41
41 -
 42
42 -
 43
43 -
 44
44 -
45
-
46
-
47
-
48
-
49
-
50
-
51
-
52
-
53
-
54
-
55
-
56
-
57
-
58
-
59
-
60
-
61
-
62
-
63
-
64
-
65
-
66
-
67
-
68
-
69
-
70
-
71
-
72
-
73
-
74
-
75
-
76
-
77
-
78
-
79
-
80
-
81
-
82
-
83
-
84
-
85
-
86
-
87
-
88
-
89
-
90
-
91
-
92
-
93
-
94
-
95
-
96
-
97
-
98
-
99
-
100
-
101
-
102
-
103
-
104
-
105
-
106
-
107
-
108
-
109
-
110
-
111
-
112
-
113
-
114
-
115
-
116
-
117
-
118
-
119
-
120
-
121
-
122
-
123
-
124
-
125
-
126
-
127
-
128
-
129
-
130
-
131
-
132
-
133
-
134
-
135
-
136
-
137
-
138
 |
 |

Table of Contents
Fee and Other Revenue
Fee and other revenue consists of transaction fees, foreign exchange revenue and miscellaneous revenue. Transaction fees are earned on money
transfer, bill payment, money order and official check transactions. The Company derives money transfer revenues primarily from consumer
transaction fees and the management of currency exchange spreads involving different "send" and "receive" countries. Miscellaneous revenue
primarily consists of processing fees on rebate checks and controlled disbursements, service charges on aged outstanding money orders and
money order dispenser fees.
In 2013 and 2012 , the Company generated fee and other revenue growth of $128.2 million , or 10 percent , and $97.7 million , or eight percent
,
respectively. For both 2013 and 2012
, fee and other revenue growth was driven by transaction growth of the money transfer product and was
partially offset by transaction declines from the bill payment, money order and official check products.
Fee and Other Commissions Expense
The Company incurs fee commissions primarily on our Global Funds Transfer products. In a money transfer transaction, both the agent initiating
the transaction and the receiving agent earn a commission that is generally based on a percentage of the fee charged to the consumer. In a bill
payment transaction, the agent initiating the transaction receives a commission and, in limited circumstances, the biller will generally earn a
commission that is based on a percentage of the fee charged to the consumer. We generally do not pay commissions to agents on the sale of
money orders, except, in certain limited circumstances, for large agents where we may pay a fixed commission based on total money order
transactions. Other commissions expense includes the amortization of capitalized agent signing bonus payments.
In 2013 , fee and other commissions expense growth of $78.6 million , or 13 percent
, was primarily due to the transaction growth from the
money transfer product, changes in the corridor and agent mix, a step-
up in the commission rate for a large agent and increased signing bonus
amortization from our agent expansion and retention efforts. Commissions expense as a percentage of fee and other revenue increased to
46.5
percent in 2013 from 45.1 percent in 2012 . In 2012 , fee and other commissions expense growth of $51.6 million , or nine percent
, was
primarily due to money transfer volume growth and increased commission rate. Commissions expense as a percentage of fee and other revenue
increased to 45.1 percent in 2012 from 44.5 percent in 2011 .
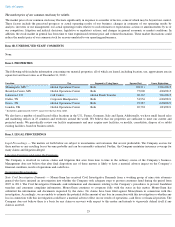
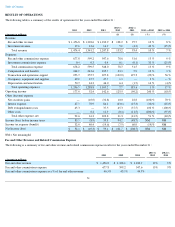
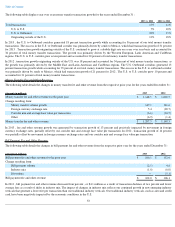
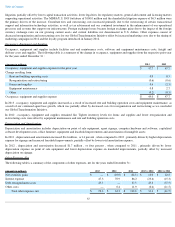
Global Funds Transfer Fee and Other Revenue
The following discussion provides a summary of fee and other revenue for the Global Funds Transfer segment for the years ended
December
31 . Investment revenue is not included in the analysis. See " Investment Revenue Analysis " for additional information.
For 2013 and 2012 , Global Funds Transfer fee and other revenue increased $134.9 million and $102.5 million
, respectively, driven by money
transfer volume growth of 13 percent and 14 percent , respectively. In 2013 , bill payment revenue declined four percent
as a result of transaction
decline of two percent and a decrease in average fee per transactions as a result of industry mix. In 2012
, bill payment fee and other revenue
decreased primarily due to the 2011 PropertyBridge divestiture (See Note 3 — Acquisitions and Disposals
of the Notes to the Consolidated
Financial Statements for additional disclosure). Excluding the divestiture, fee and other revenue decreased one percent and transactions grew
five percent.
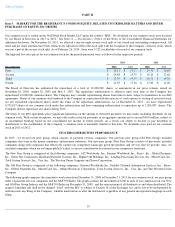
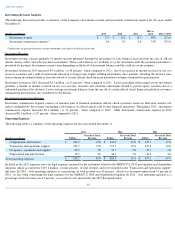
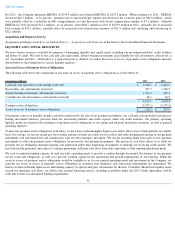
Money Transfer Transactions
The following table displays the percentage distribution of total money transfer transactions for the years ended December 31 :
32
(Amounts in millions) 2013
2012
2011
2013 vs
2012
2012 vs
2011
Money transfer:
Fee and other revenue
$
1,287.5
$
1,148.5
$
1,039.5
12
%
10
%
Bill payment:
Fee and other revenue
102.0
106.1
112.6
(4
)%
(6
)%
Total Global Funds Transfer:
Fee and other revenue
$
1,389.5
$
1,254.6
$
1,152.1
11
%
9
%
Fee and other commissions expense
$
676.9
$
597.6
$
545.7
13
%
10
%
2013
2012
2011
U.S. to U.S.
30
%
31
%
32
%
U.S. to Outbound
36
%
35
%
35
%
Originating outside of the U.S.
34
%
34
%
33
%