MoneyGram 2013 Annual Report Download - page 47
Download and view the complete annual report
Please find page 47 of the 2013 MoneyGram annual report below. You can navigate through the pages in the report by either clicking on the pages listed below, or by using the keyword search tool below to find specific information within the annual report.-
 1
1 -
2
-
3
-
4
-
5
-
6
-
7
-
8
-
9
-
10
-
11
-
12
-
13
-
14
-
15
-
16
-
17
-
18
-
19
-
20
-
21
-
22
-
23
-
24
-
25
-
26
-
27
-
28
-
29
-
30
-
31
-
32
-
33
-
34
-
35
-
36
-
 37
37 -
 38
38 -
 39
39 -
 40
40 -
 41
41 -
 42
42 -
 43
43 -
 44
44 -
 45
45 -
 46
46 -
 47
47 -
 48
48 -
 49
49 -
 50
50 -
 51
51 -
 52
52 -
 53
53 -
 54
54 -
 55
55 -
 56
56 -
 57
57 -
58
-
59
-
60
-
61
-
62
-
63
-
64
-
65
-
66
-
67
-
68
-
69
-
70
-
71
-
72
-
73
-
74
-
75
-
76
-
77
-
78
-
79
-
80
-
81
-
82
-
83
-
84
-
85
-
86
-
87
-
88
-
89
-
90
-
91
-
92
-
93
-
94
-
95
-
96
-
97
-
98
-
99
-
100
-
101
-
102
-
103
-
104
-
105
-
106
-
107
-
108
-
109
-
110
-
111
-
112
-
113
-
114
-
115
-
116
-
117
-
118
-
119
-
120
-
121
-
122
-
123
-
124
-
125
-
126
-
127
-
128
-
129
-
130
-
131
-
132
-
133
-
134
-
135
-
136
-
137
-
138
 |
 |

Table of Contents
We have a funded, noncontributory pension plan that is frozen to both future benefit accruals and new participants. It is our policy to fund at
least the minimum required contribution each year plus additional discretionary amounts as available and necessary to minimize expenses of the
plan. We made contributions of $6.3 million to the defined benefit pension plan during 2013 . We anticipate a minimum contribution of
$6.7
million to the defined benefit pension plan in 2014
. We also have certain unfunded pension and postretirement plans that require benefit
payments over extended periods of time. During 2013 , we paid benefits totaling $4.6 million
related to these unfunded plans. Benefit payments
under these unfunded plans are expected to be $7.1 million in 2014
. Expected contributions and benefit payments under these plans are not
included in the above table, as it is difficult to estimate the timing and amount of benefit payments and required contributions beyond the next
12 months. See Note 10 — Pensions and Other Benefits of the Notes to the Consolidated Financial Statements for additional disclosure.
The liability for unrecognized tax benefits was $52.0 million as of December 31, 2013 . The Company’
s consolidated income tax returns for
fiscal years 2005-
2009 were under examination by the IRS. The IRS issued Notices of Deficiency disallowing among other items approximately
$900.0 million
of deductions on securities losses in the 2007, 2008 and 2009 tax returns. The Company petitioned the U.S. Tax Court contesting
adjustments related to the securities losses in 2007, 2008 and 2009. As of December 31, 2013, the IRS and the Company have reached a partial
settlement on $186.9 million
of deductions in dispute. The Company intends to pursue its position with respect to the remaining adjustments. If
the Company's petition on the remaining issues is denied in its entirety, the Company would be required to make cash payments of
approximately $60.7 million based on benefits taken and taxable income earned through December 31, 2013
. These amounts are excluded from
the table above as there is a high degree of uncertainty regarding the amount and timing of potential future cash outflows associated with the
liability, and we are unable to make a reasonably reliable estimate of the amount and period in which these liabilities might be paid.
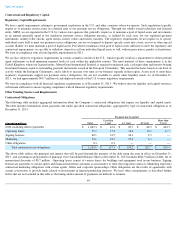
In limited circumstances, we may grant minimum commission guarantees as an incentive to new or renewing agents for a specified period of
time at a contractually specified amount. Under the guarantees, we will pay to the agent the difference between the contractually specified
minimum commission and the actual commissions earned by the agent. As of December 31, 2013
, the minimum commission guarantees had a
maximum payment of $13.3 million over a weighted average remaining term of 3.9 years
. The maximum payment is calculated as the
contractually guaranteed minimum commission times the remaining term of the contract and, therefore, assumes that the agent generates no
money transfer transactions during the remainder of its contract. As of December 31, 2013
, the liability for minimum commission guarantees
was $4.0 million . Minimum commission guarantees are not reflected in the table above.
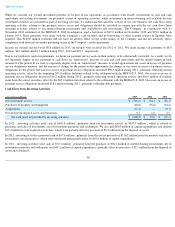
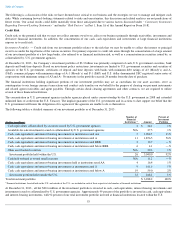
Analysis of Cash Flows
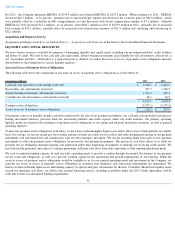
Cash Flows from Operating Activities
In 2013 , operating activities generated net cash of $610.5 million
, as our net cash before changes in payment service assets and obligations was
$164.9 million . Changes in our payment service assets and obligations generated $445.6 million
of operating cash flows, from the timing of
collection and settlement of our payment service assets and obligations, as well as the changes in composition of our investment portfolio.
In 2012 , operating activities utilized net cash of $56.1 million
, as our net cash before changes in payment service assets and obligations was
$78.9 million . Changes in our payment service assets and obligations utilized $135.0 million
of operating cash flows, from the timing of
collection and settlement of our payment service assets and obligations, as well as the changes in composition of our investment portfolio and
the $65.0 million forfeiture related to the settlement with the MDPA/U.S. DOJ.
In 2011 , operating activities generated net cash of $188.1 million
, as our net cash before changes in payment service assets and obligations was
and $121.0 million . Changes in our payment service assets and obligations generated $67.1 million of operating cash flows in 2011
, from the
timing of collection and settlement of our payment service assets and obligations, as well as the changes in composition of our investment
portfolio.
45
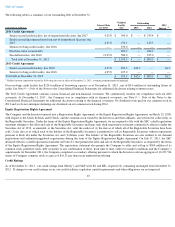
(Amounts in millions) 2013
2012
2011
Net income (loss)
$
52.4
$
(49.3
)
$
59.4
Total adjustments to reconcile net income (loss)
112.5
128.2
61.6
Net cash provided by operating activities before changes in payment service assets and
obligations
164.9
78.9
121.0
Change in cash and cash equivalents (substantially restricted)
454.7
(111.0
)
291.8
Change in receivables, net (substantially restricted)
429.2
6.0
(245.3
)
Change in payment service obligations
(438.3
)
(30.0
)
20.6
Net change in payment service assets and obligations
445.6
(135.0
)
67.1
Net cash provided by (used in) operating activities
$
610.5
$
(56.1
)
$
188.1