MoneyGram 2013 Annual Report Download - page 35
Download and view the complete annual report
Please find page 35 of the 2013 MoneyGram annual report below. You can navigate through the pages in the report by either clicking on the pages listed below, or by using the keyword search tool below to find specific information within the annual report.-
 1
1 -
2
-
3
-
4
-
5
-
6
-
7
-
8
-
9
-
10
-
11
-
12
-
13
-
14
-
15
-
16
-
17
-
18
-
19
-
20
-
21
-
22
-
23
-
24
-
 25
25 -
 26
26 -
 27
27 -
 28
28 -
 29
29 -
 30
30 -
 31
31 -
 32
32 -
 33
33 -
 34
34 -
 35
35 -
 36
36 -
 37
37 -
 38
38 -
 39
39 -
 40
40 -
 41
41 -
 42
42 -
 43
43 -
 44
44 -
 45
45 -
46
-
47
-
48
-
49
-
50
-
51
-
52
-
53
-
54
-
55
-
56
-
57
-
58
-
59
-
60
-
61
-
62
-
63
-
64
-
65
-
66
-
67
-
68
-
69
-
70
-
71
-
72
-
73
-
74
-
75
-
76
-
77
-
78
-
79
-
80
-
81
-
82
-
83
-
84
-
85
-
86
-
87
-
88
-
89
-
90
-
91
-
92
-
93
-
94
-
95
-
96
-
97
-
98
-
99
-
100
-
101
-
102
-
103
-
104
-
105
-
106
-
107
-
108
-
109
-
110
-
111
-
112
-
113
-
114
-
115
-
116
-
117
-
118
-
119
-
120
-
121
-
122
-
123
-
124
-
125
-
126
-
127
-
128
-
129
-
130
-
131
-
132
-
133
-
134
-
135
-
136
-
137
-
138
 |
 |
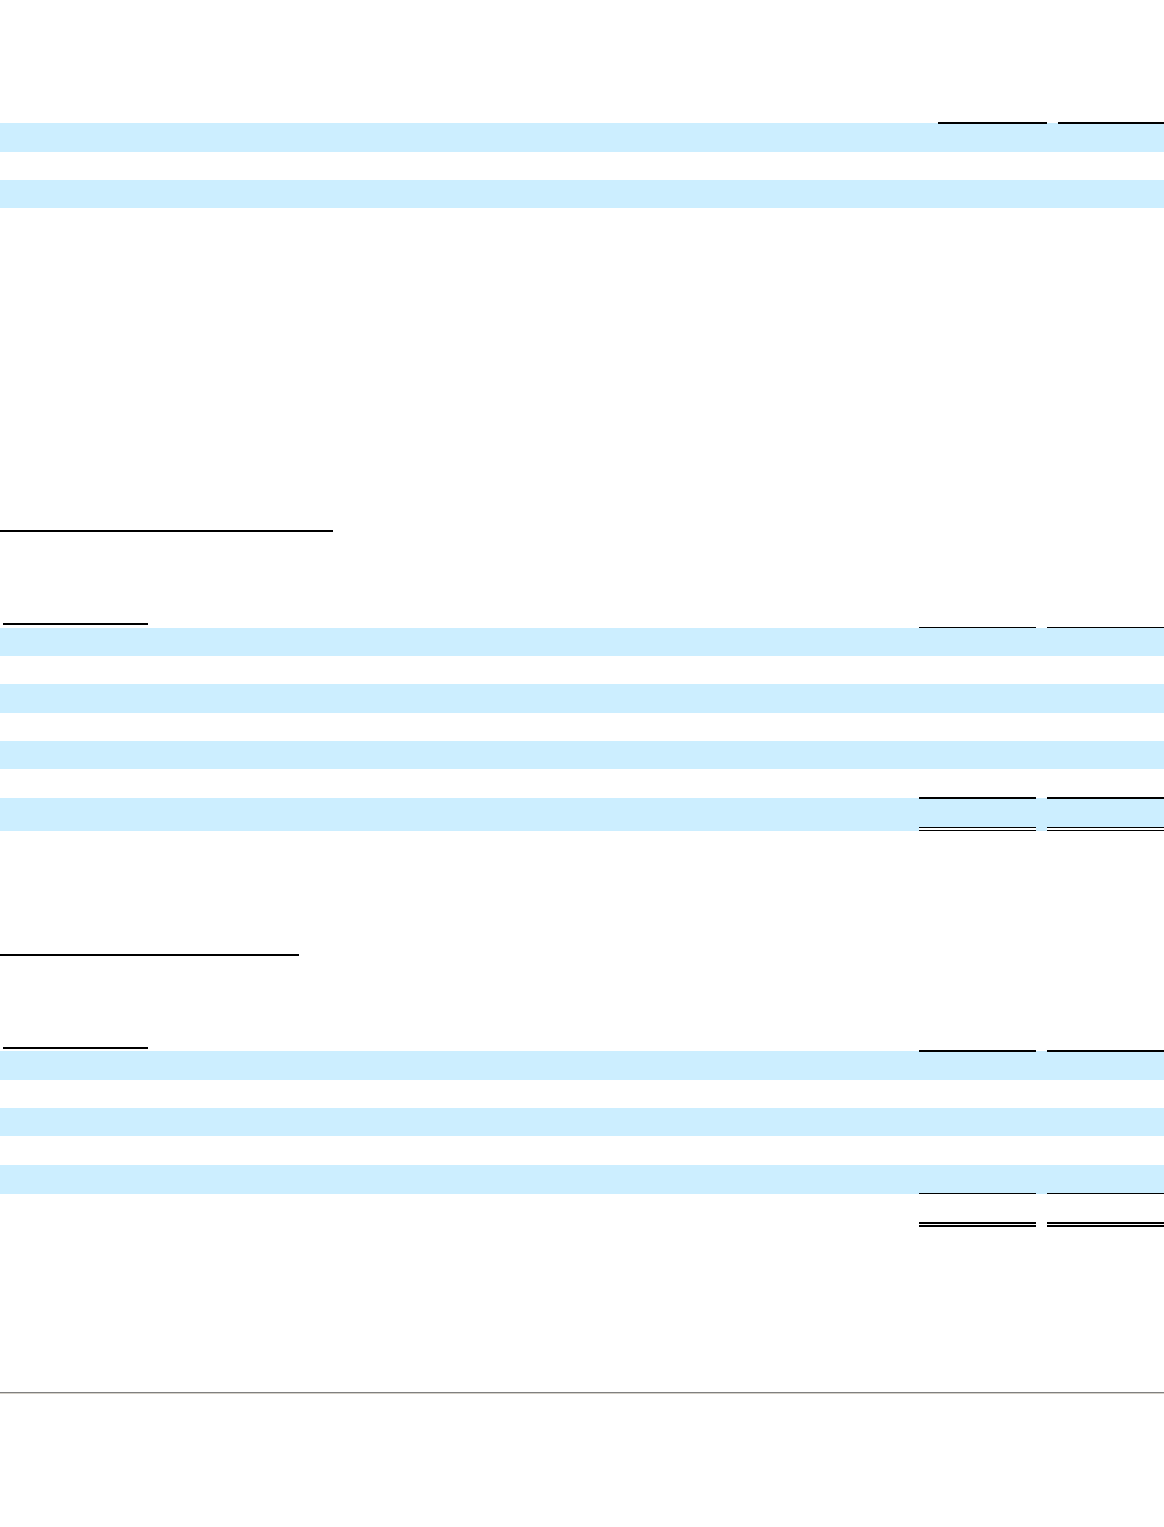
Table of Contents
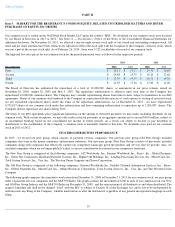
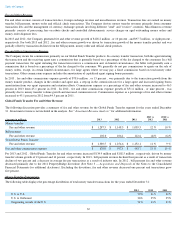
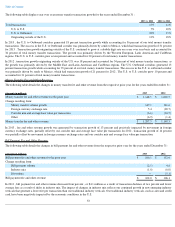
The following table displays year over year money transfer transaction growth for the years ended December 31 :
In 2013 , the U.S. to Outbound corridors generated 18 percent transaction growth while accounting for 36 percent
of our total money transfer
transactions. The success in the U.S. to Outbound corridor was primarily driven by sends to Mexico, which had transaction growth of 31 percent
for 2013
. Transaction growth originating outside of the U.S. continued to grow at a double digit rate on a year over year basis and accounted for
34 percent
of total money transfer transactions. The growth was primarily driven by the Western European, Latin American and Caribbean
regions. The U.S. to U.S. corridor grew seven percent and accounted for 30 percent of total money transfer transactions.
In 2012 , transaction growth originating outside of the U.S. was 18 percent and accounted for 34 percent
of total money transfer transactions, as
the growth was primarily driven by the Middle East and Latin American and Caribbean regions. The U.S. Outbound corridors generated
13
percent transaction growth while accounting for 35 percent
of our total money transfer transactions. The success in the U.S. to outbound corridor
was primarily driven by sends to Mexico, which had transaction growth of 21 percent for 2012 . The U.S. to U.S. corridor grew 10 percent
and
accounted for 31 percent of total money transfer transactions.
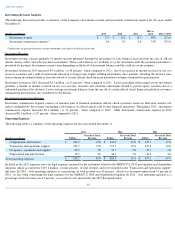
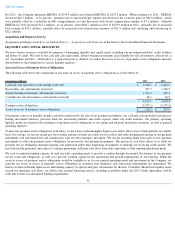
Money Transfer Fee and Other Revenue
The following table details the changes in money transfer fee and other revenue from the respective prior year for the years ended December 31
:
In 2013 , fee and other revenue growth was generated by transaction growth of 13 percent
and positively impacted by movement in foreign
currency exchange rates, partially offset by our corridor mix and average face value per transaction. In 2012 , transaction growth of
14 percent
was partially offset by movement in foreign currency exchange rates and our corridor mix and average face value per transaction.
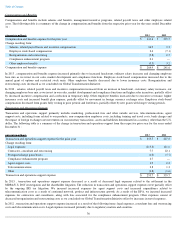
Bill Payment Fee and Other Revenue
The following table details the changes in bill payment fee and other revenue from the respective prior year for the years ended December 31 :
In 2013 , bill payment fee and other revenue decreased four percent , or $4.1 million as a result of transaction declines of two percent
and lower
average fees as a result of shifts in industry mix. The impact of changes in industry mix reflects our continued growth in new emerging industry
verticals that generate a lower fee per transaction than our traditional industry verticals. Our traditional industry verticals, such as auto and credit
card, have been negatively impacted by the economic conditions in the U.S.
33
2013 vs 2012
2012 vs 2011
Total transactions
13
%
14
%
U.S. to U.S.
7
%
10
%
U.S. to Outbound
18
%
13
%
Originating outside of the U.S.
13
%
18
%
(Amounts in millions) 2013
2012
Money transfer fee and other revenue for the prior year
$
1,148.5
$
1,039.5
Change resulting from:
Money transfer volume growth
147.1
141.6
Foreign currency exchange rate
5.4
(20.7
)
Corridor mix and average face value per transaction
(6.6
)
(10.5
)
Other
(6.9
)
(1.4
)
Money transfer fee and other revenue
$
1,287.5
$
1,148.5
(Amounts in millions) 2013
2012
Bill payment fee and other revenue for the prior year
$
106.1
$
112.6
Change resulting from:
Bill payment volume
(2.5
)
4.6
Industry mix
(1.6
)
(6.0
)
Divestiture
—
(
5.1
)
Bill payment fee and other revenue
$
102.0
$
106.1