MoneyGram 2013 Annual Report Download - page 57
Download and view the complete annual report
Please find page 57 of the 2013 MoneyGram annual report below. You can navigate through the pages in the report by either clicking on the pages listed below, or by using the keyword search tool below to find specific information within the annual report.-
 1
1 -
2
-
3
-
4
-
5
-
6
-
7
-
8
-
9
-
10
-
11
-
12
-
13
-
14
-
15
-
16
-
17
-
18
-
19
-
20
-
21
-
22
-
23
-
24
-
25
-
26
-
27
-
28
-
29
-
30
-
31
-
32
-
33
-
34
-
35
-
36
-
37
-
38
-
39
-
40
-
41
-
42
-
43
-
44
-
45
-
46
-
 47
47 -
 48
48 -
 49
49 -
 50
50 -
 51
51 -
 52
52 -
 53
53 -
 54
54 -
 55
55 -
 56
56 -
 57
57 -
 58
58 -
 59
59 -
 60
60 -
 61
61 -
 62
62 -
 63
63 -
 64
64 -
 65
65 -
 66
66 -
 67
67 -
68
-
69
-
70
-
71
-
72
-
73
-
74
-
75
-
76
-
77
-
78
-
79
-
80
-
81
-
82
-
83
-
84
-
85
-
86
-
87
-
88
-
89
-
90
-
91
-
92
-
93
-
94
-
95
-
96
-
97
-
98
-
99
-
100
-
101
-
102
-
103
-
104
-
105
-
106
-
107
-
108
-
109
-
110
-
111
-
112
-
113
-
114
-
115
-
116
-
117
-
118
-
119
-
120
-
121
-
122
-
123
-
124
-
125
-
126
-
127
-
128
-
129
-
130
-
131
-
132
-
133
-
134
-
135
-
136
-
137
-
138
 |
 |
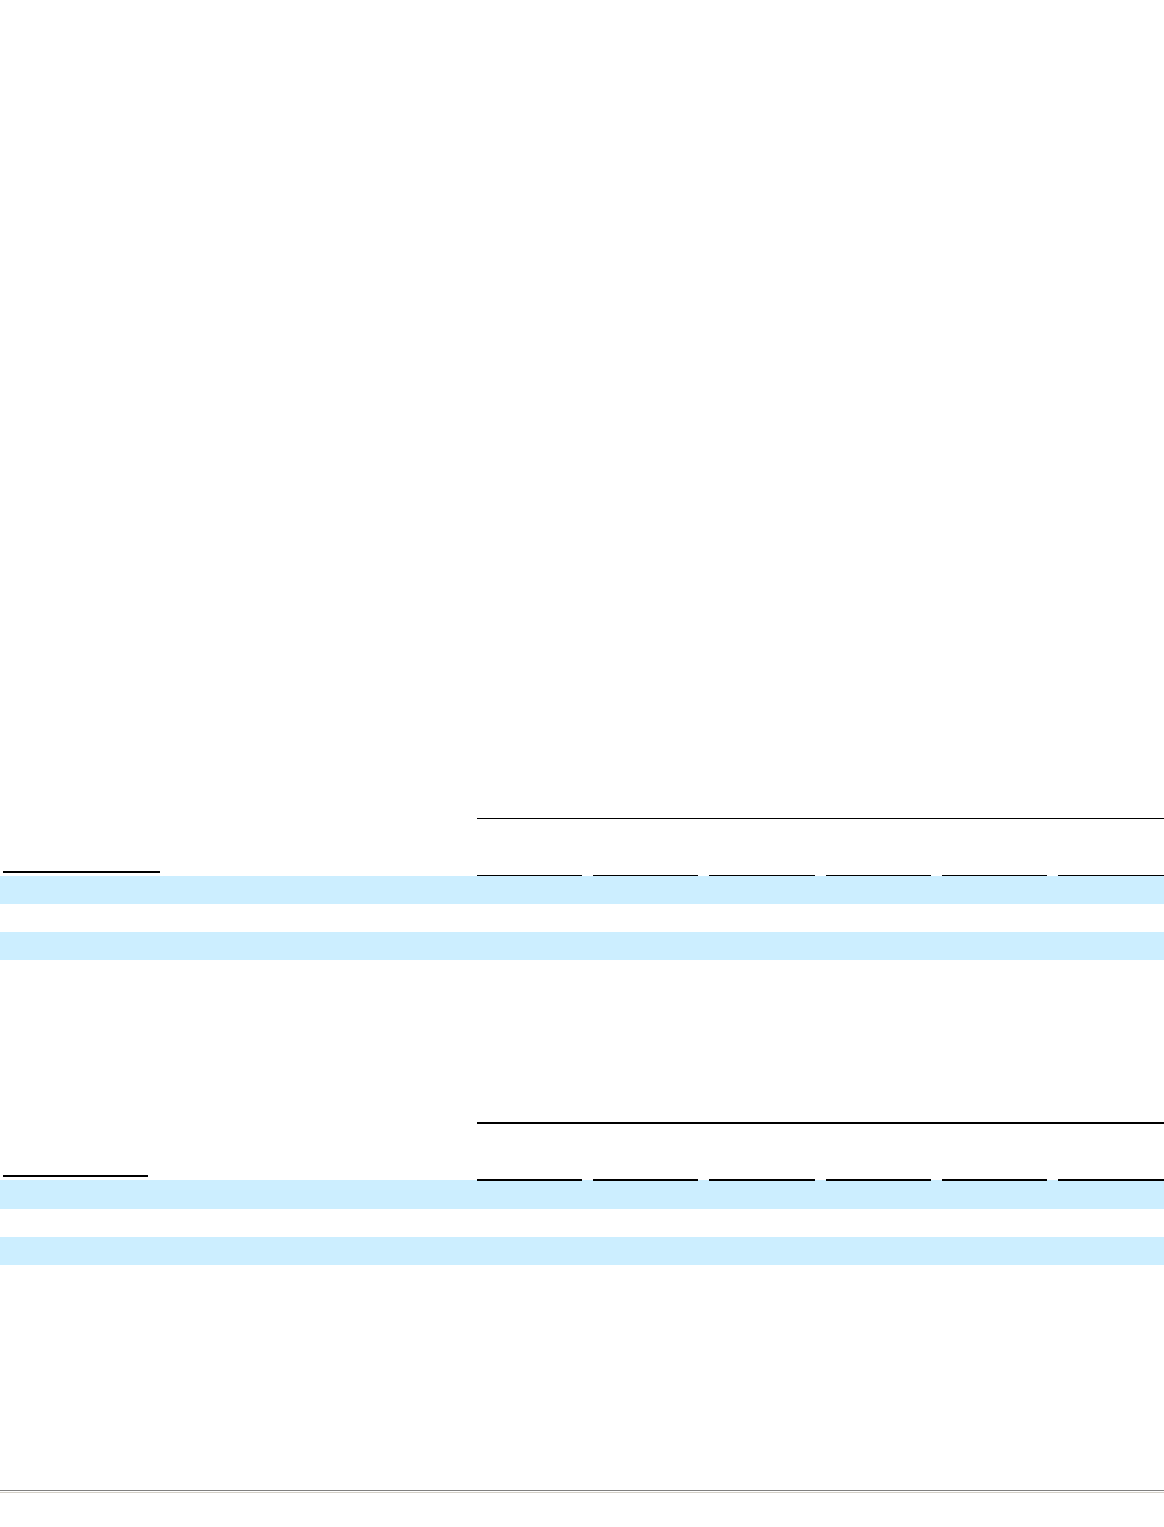
Table of Contents
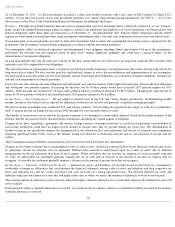
Our operating results are impacted by interest rate risk through our net investment margin, which is investment revenue less investment
commissions expense. As the money transfer business is not materially affected by investment revenue and pays commissions that are not tied to
an interest rate index, interest rate risk has the most impact on our money order and official check businesses. We are invested primarily in
interest-
bearing cash accounts, deposit accounts, time deposits, certificates of deposit and U.S. government money market funds. These types of
investments have minimal risk of declines in fair value from changes in interest rates. Our commissions paid to financial institution customers
are variable rate, based primarily on the federal funds effective rate and are reset daily. Accordingly, both our investment revenue and our
investment commissions expense will decrease when rates decline and increase when rates rise. In the current environment, the federal funds
effective rate is so low that most of our financial institution customers are in a “negative”
commission position, and therefore we do not owe any
commissions to these customers.
Our results are impacted by interest rate risk through our interest expense on our 2013 Credit Agreement. The Company may elect an interest
rate for its debt under the 2013 Credit Agreement at each reset period based on the BOA prime bank rate or the Eurodollar rate. The interest rate
election may be made individually for the Term Credit Facility and each draw under the Revolving Credit Facility. The interest rate will be
either the “alternate base rate” (calculated in part based on the BOA prime rate) plus either 200 or 225
basis points (depending on the Company's
secured leverage ratio or total leverage ratio, as applicable, at such time) or the Eurodollar rate plus either 300 or 325
basis points (depending on
the Company's secured leverage ratio or total leverage ratio, as applicable, at such time). In connection with the initial funding under the 2013
Credit Agreement, the Company elected the Eurodollar rate as its primary interest basis. Under the terms of the 2013 Credit Agreement, the
minimum interest rate applicable to Eurodollar borrowings under the Term Credit Facility is 100
basis points plus the applicable margins
previously referred to in this paragraph. Accordingly, any increases in interest rates will adversely affect interest expense.
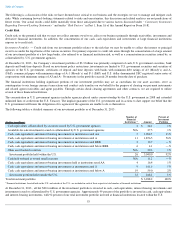
The tables below incorporate substantially all of our interest rate sensitive assets and assumptions that reflect changes in all interest rates
pertaining to the balance sheet. The “ramp” analysis assumes that interest rates change in even increments over the next 12 months. The “shock”
analysis assumes interest rates change immediately and remain at the changed level for the next twelve months. Components of our pre-
tax
income (loss) that are interest rate sensitive include “Investment revenue,” “Investment commissions expense” and “Interest expense”.
In the
current interest rate environment where rates are approaching zero, our risk associated with declining rates is not material. A moderately rising
interest rate environment would be generally beneficial to the Company because variable rate assets exceed our variable rate liabilities, and
certain of our variable rate liabilities will not react to increases in interest rates until those rates exceed the floor set for the index rate on the
corresponding debt.
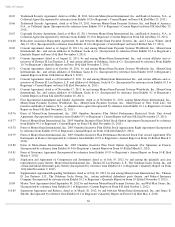
The following table summarizes the changes to affected components of the income statement under various ramp scenarios as of December 31,
2013:
NM = Not meaningful
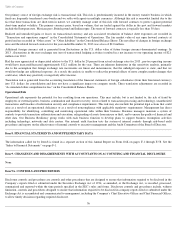
The following table summarizes the changes to affected components of the income statement under various shock scenarios as of December 31,
2013:
NM = Not meaningful
Foreign Currency Risk
We are exposed to foreign currency risk in the ordinary course of business as we offer our products and services through a network of agents and
financial institutions with locations in more than 200
countries and territories. By policy, we do not speculate in foreign currencies; all currency
trades relate to underlying transactional exposures.
55
Basis Point Change in Interest Rates
Down
Down
Down
Up
Up
Up
( Amounts in millions) 200
100
50
50
100
200
Investment revenue
$
(3.1
)
$
(3.0
)
$
(2.7
)
$
4.8
$
9.5
$
19.0
Investment commissions expense
0.3
0.3
0.3
(0.8
)
(2.0
)
(8.9
)
Interest expense
NM
NM
NM
NM
(0.8
)
(2.6
)
Change in pretax income
$
(2.8
)
$
(2.7
)
$
(2.4
)
$
4.0
$
6.7
$
7.5
Basis Point Change in Interest Rates
Down
Down
Down
Up
Up
Up
(Amounts in millions) 200
100
50
50
100
200
Investment revenue
$
(3.1
)
$
(3.1
)
$
(3.1
)
$
9.3
$
18.7
$
37.3
Investment commissions expense
0.3
0.3
0.3
(1.5
)
(3.6
)
(20.4
)
Interest expense
NM
NM
NM
NM
(4.0
)
(11.1
)
Change in pretax income
$
(2.8
)
$
(2.8
)
$
(2.8
)
$
7.8
$
11.1
$
5.8