MoneyGram 2013 Annual Report Download - page 39
Download and view the complete annual report
Please find page 39 of the 2013 MoneyGram annual report below. You can navigate through the pages in the report by either clicking on the pages listed below, or by using the keyword search tool below to find specific information within the annual report.-
 1
1 -
2
-
3
-
4
-
5
-
6
-
7
-
8
-
9
-
10
-
11
-
12
-
13
-
14
-
15
-
16
-
17
-
18
-
19
-
20
-
21
-
22
-
23
-
24
-
25
-
26
-
27
-
28
-
 29
29 -
 30
30 -
 31
31 -
 32
32 -
 33
33 -
 34
34 -
 35
35 -
 36
36 -
 37
37 -
 38
38 -
 39
39 -
 40
40 -
 41
41 -
 42
42 -
 43
43 -
 44
44 -
 45
45 -
 46
46 -
 47
47 -
 48
48 -
 49
49 -
50
-
51
-
52
-
53
-
54
-
55
-
56
-
57
-
58
-
59
-
60
-
61
-
62
-
63
-
64
-
65
-
66
-
67
-
68
-
69
-
70
-
71
-
72
-
73
-
74
-
75
-
76
-
77
-
78
-
79
-
80
-
81
-
82
-
83
-
84
-
85
-
86
-
87
-
88
-
89
-
90
-
91
-
92
-
93
-
94
-
95
-
96
-
97
-
98
-
99
-
100
-
101
-
102
-
103
-
104
-
105
-
106
-
107
-
108
-
109
-
110
-
111
-
112
-
113
-
114
-
115
-
116
-
117
-
118
-
119
-
120
-
121
-
122
-
123
-
124
-
125
-
126
-
127
-
128
-
129
-
130
-
131
-
132
-
133
-
134
-
135
-
136
-
137
-
138
 |
 |

Table of Contents
litigation, partially offset by lower capital transaction activities, lower legal fees for regulatory matters, general advisement and licensing matters
supporting operational activities. The MDPA/U.S. DOJ forfeiture of $100.0 million and the shareholder litigation expense of $6.5 million were
the primary drivers of the increase. Consultant fees and outsourcing costs increased primarily due to the outsourcing of certain transactional
support and information technology activities, as well as tax advisement and our continued investment in the enhancement of our operational
processes and systems that support our infrastructure. Foreign exchange losses became foreign exchange gains due to the impact of the foreign
currency exchange rates on our growing current assets and current liabilities not denominated in U.S. dollars. Other expenses consist of
decreased reorganization and restructuring costs for our Global Transformation Initiative offset by increased marketing costs due to the timing of
marketing campaigns in 2012 and the loyalty program introduced in January 2012.
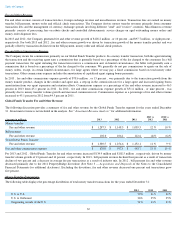
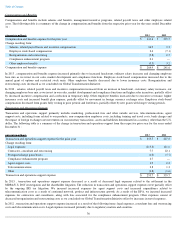
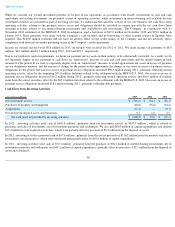
Occupancy, Equipment and Supplies
Occupancy, equipment and supplies include facilities rent and maintenance costs, software and equipment maintenance costs, freight and
delivery costs and supplies. The following table is a summary of the change in occupancy, equipment and supplies from the respective prior year
for the years ended December 31 :
In 2013
, occupancy, equipment and supplies increased as a result of increased rent and building operation costs and equipment maintenance, as
a result of our continued agent base growth, which was partially offset by decreased costs for reorganization and restructuring as we concluded
our Global Transformation Initiative.
In 2012
, occupancy, equipment and supplies remained flat. Tighter inventory levels for forms and supplies and lower reorganization and
restructuring costs were offset by equipment maintenance and rent and building operation costs.
Depreciation and Amortization
Depreciation and amortization includes depreciation on point of sale equipment, agent signage, computer hardware and software, capitalized
software development costs, office furniture, equipment and leasehold improvements and amortization of intangible assets.
In 2013 , depreciation and amortization increased $6.4 million , or 14 percent , when compared to 2012
, primarily driven by higher depreciation
expense for signage and increased leasehold improvements, partially offset by lower total amortization expense.
In 2012 , depreciation and amortization decreased $1.7 million , or four percent , when compared to 2011
, primarily driven by lower
depreciation expense on point of sale equipment and lower depreciation expense on leasehold improvements, partially offset by increased
depreciation on signage.
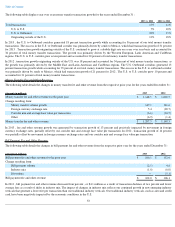
Other Expenses, Net
The following table is a summary of the components of other expenses, net for the years ended December 31 :
37
(Amounts in millions) 2013
2012
Occupancy, equipment and supplies expense for the prior year
$
47.7
$
47.7
Change resulting from:
Rent and building operating costs
0.9
0.5
Reorganization and restructuring
(0.6
)
(0.6
)
Forms and supplies
0.4
(2.3
)
Equipment maintenance
0.8
2.7
Other
(0.2
)
(0.3
)
Occupancy, equipment and supplies expense
$
49.0
$
47.7
(Amounts in millions) 2013
2012
2011
2013 vs 2012
2012 vs 2011
Net securities gains
$
—
$
(
10.0
)
$
(32.8
)
$
10.0
$
22.8
Interest expense
47.3
70.9
86.2
(23.6
)
(15.3
)
Debt extinguishment costs
45.3
—
37.5
45.3
(37.5
)
Other costs
—
0.4
11.9
(0.4
)
(11.5
)
Total other expense, net
$
92.6
$
61.3
$
102.8
$
31.3
$
(41.5
)