MoneyGram 2013 Annual Report Download - page 101
Download and view the complete annual report
Please find page 101 of the 2013 MoneyGram annual report below. You can navigate through the pages in the report by either clicking on the pages listed below, or by using the keyword search tool below to find specific information within the annual report.-
 1
1 -
2
-
3
-
4
-
5
-
6
-
7
-
8
-
9
-
10
-
11
-
12
-
13
-
14
-
15
-
16
-
17
-
18
-
19
-
20
-
21
-
22
-
23
-
24
-
25
-
26
-
27
-
28
-
29
-
30
-
31
-
32
-
33
-
34
-
35
-
36
-
37
-
38
-
39
-
40
-
41
-
42
-
43
-
44
-
45
-
46
-
47
-
48
-
49
-
50
-
51
-
52
-
53
-
54
-
55
-
56
-
57
-
58
-
59
-
60
-
61
-
62
-
63
-
64
-
65
-
66
-
67
-
68
-
69
-
70
-
71
-
72
-
73
-
74
-
75
-
76
-
77
-
78
-
79
-
80
-
81
-
82
-
83
-
84
-
85
-
86
-
87
-
88
-
89
-
90
-
 91
91 -
 92
92 -
 93
93 -
 94
94 -
 95
95 -
 96
96 -
 97
97 -
 98
98 -
 99
99 -
 100
100 -
 101
101 -
 102
102 -
 103
103 -
 104
104 -
 105
105 -
 106
106 -
 107
107 -
 108
108 -
 109
109 -
 110
110 -
 111
111 -
112
-
113
-
114
-
115
-
116
-
117
-
118
-
119
-
120
-
121
-
122
-
123
-
124
-
125
-
126
-
127
-
128
-
129
-
130
-
131
-
132
-
133
-
134
-
135
-
136
-
137
-
138
 |
 |
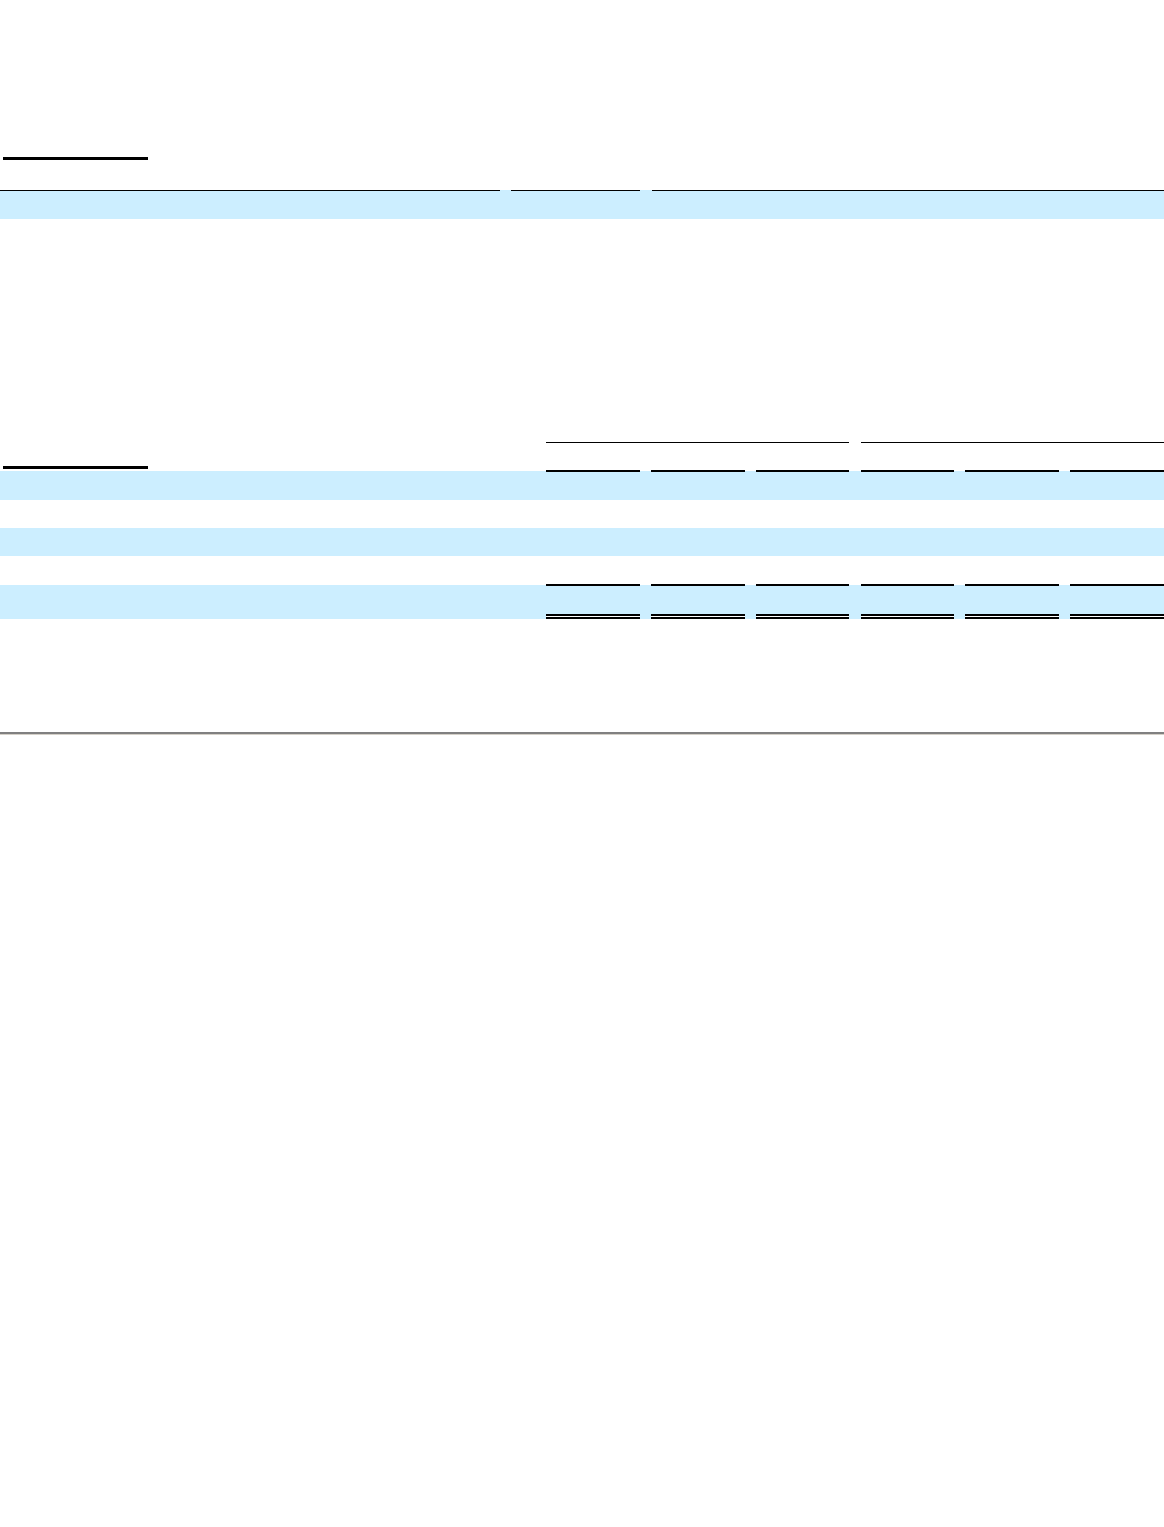
Table of Contents
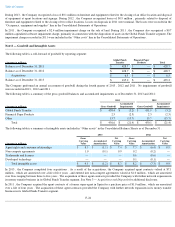
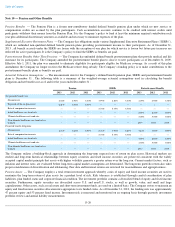
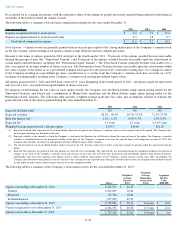
The following table represents the Pension Plan's Level 3 financial instrument, the valuation techniques used to measure the fair value of the
financial instrument, and the significant unobservable inputs and the ranges of values for those inputs.
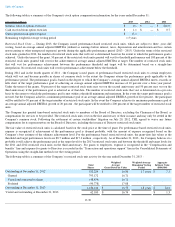
In estimating fair value of the investments in Level 3, the Company may use third party pricing sources or appraisers. In substantiating the
reasonableness of the pricing data provided by third parties, the Company evaluates a variety of factors including review of methods and
assumptions used by external sources, recently executed transactions, existing contracts, economic conditions, industry and market
developments, and overall credit ratings.
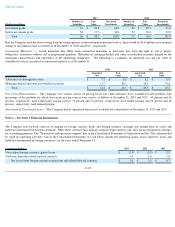
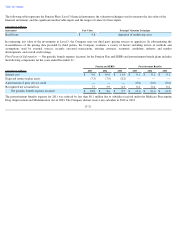
Plan Financial Information
—
Net periodic benefit expense (income) for the Pension Plan and SERPs and postretirement benefit plans includes
the following components for the years ended December 31 :
The postretirement benefits expense for 2011 was reduced by less than $0.1 million
due to subsidies received under the Medicare Prescription
Drug, Improvement and Modernization Act of 2003. The Company did not receive any subsidies in 2012 or 2013 .
F-31
(Amounts in millions)
Instrument
Fair Value
Principal Valuation Technique
Real Estate
$
4.8
Appraisal of underlying asset
Pension and SERPs
Postretirement Benefits
(Amounts in millions) 2013
2012
2011
2013
2012
2011
Interest cost
$
9.6
$
10.6
$
11.4
$
0.1
$
0.1
$
0.1
Expected return on plan assets
(7.3
)
(7.9
)
(8.2
)
—
—
—
Amortization of prior service credit —
—
—
(
0.6
)
(0.6
)
(0.6
)
Recognized net actuarial loss
7.7
5.9
6.3
0.4
0.4
0.2
Net periodic benefit expense (income)
$
10.0
$
8.6
$
9.5
$
(0.1
)
$
(0.1
)
$
(0.3
)