MoneyGram 2013 Annual Report Download - page 111
Download and view the complete annual report
Please find page 111 of the 2013 MoneyGram annual report below. You can navigate through the pages in the report by either clicking on the pages listed below, or by using the keyword search tool below to find specific information within the annual report.-
 1
1 -
2
-
3
-
4
-
5
-
6
-
7
-
8
-
9
-
10
-
11
-
12
-
13
-
14
-
15
-
16
-
17
-
18
-
19
-
20
-
21
-
22
-
23
-
24
-
25
-
26
-
27
-
28
-
29
-
30
-
31
-
32
-
33
-
34
-
35
-
36
-
37
-
38
-
39
-
40
-
41
-
42
-
43
-
44
-
45
-
46
-
47
-
48
-
49
-
50
-
51
-
52
-
53
-
54
-
55
-
56
-
57
-
58
-
59
-
60
-
61
-
62
-
63
-
64
-
65
-
66
-
67
-
68
-
69
-
70
-
71
-
72
-
73
-
74
-
75
-
76
-
77
-
78
-
79
-
80
-
81
-
82
-
83
-
84
-
85
-
86
-
87
-
88
-
89
-
90
-
91
-
92
-
93
-
94
-
95
-
96
-
97
-
98
-
99
-
100
-
 101
101 -
 102
102 -
 103
103 -
 104
104 -
 105
105 -
 106
106 -
 107
107 -
 108
108 -
 109
109 -
 110
110 -
 111
111 -
 112
112 -
 113
113 -
 114
114 -
 115
115 -
 116
116 -
 117
117 -
 118
118 -
 119
119 -
 120
120 -
 121
121 -
122
-
123
-
124
-
125
-
126
-
127
-
128
-
129
-
130
-
131
-
132
-
133
-
134
-
135
-
136
-
137
-
138
 |
 |
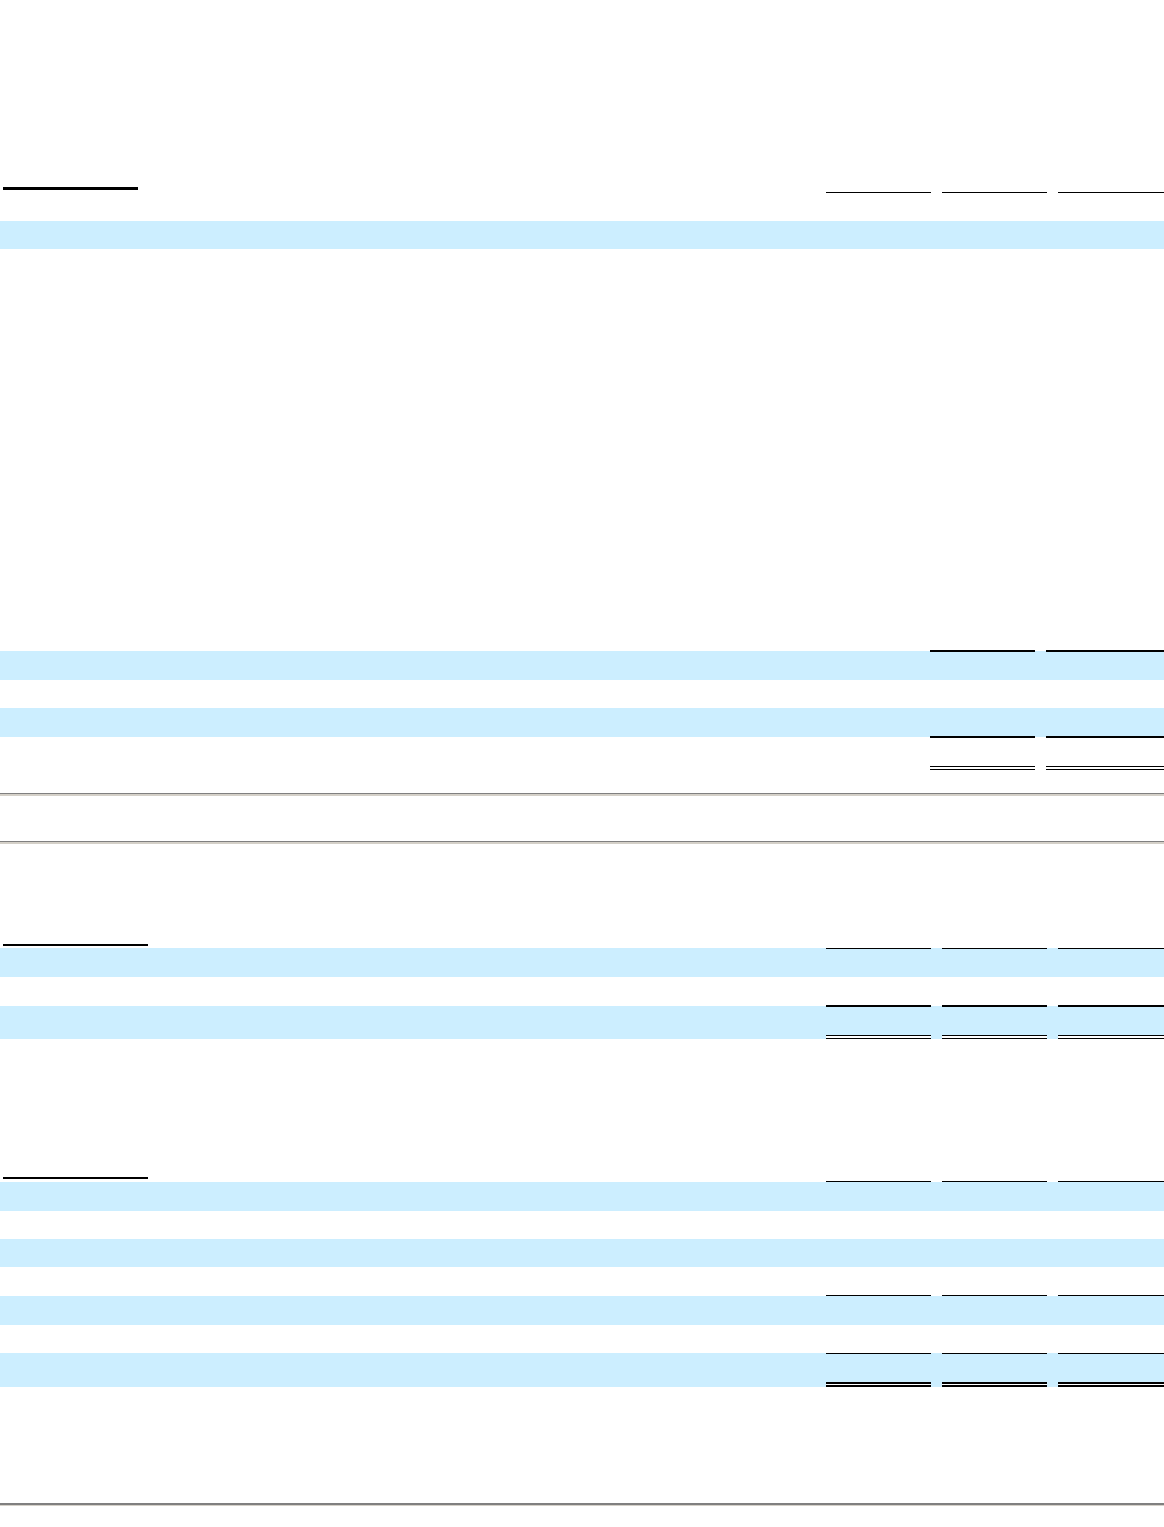
Table of Contents
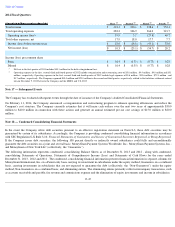
No vested restricted stock units were convertible as of
December 31, 2013 .
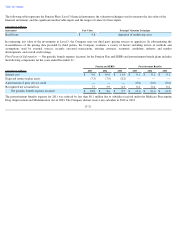
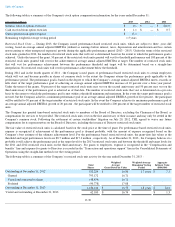
The following table is a summary of the Company's restricted stock and restricted stock unit compensation information for the years ended
December 31 :
Unrecognized restricted stock unit expense and the remaining weighted-average vesting period are presented under the Company’
s current
estimate of achievement of the performance goal on the third anniversary. Unrecognized restricted stock unit expense, as of December 31, 2013
,
under the minimum and maximum thresholds are $2.4 million and $14.1 million , respectively.
Stock Appreciation Rights —
In November 2011, the Company issued a grant of stock appreciation rights to certain employees which entitle the
holder to any per share appreciation from the price at issuance. The grants vest and become exercisable over a four-year
period in an equal
number of shares each year. Upon exercise, the employee will receive an amount that is equal to the excess of the closing sale price of the
Company’s common stock at the time of exercise over the grant price paid in cash up to a maximum of $12.00 .
The fair value of stock appreciation rights was calculated using a Black-
Scholes single option pricing model and is recorded as a liability in the
“Accounts payable and other liabilities”
line in the Consolidated Balance Sheets. Expense for stock appreciation rights is recognized in the
“Compensation and benefits” line in the Consolidated Statements of Operations using the straight-
line method over the vesting period. Expense
related to stock appreciation rights was nominal for 2013 and 2012 .
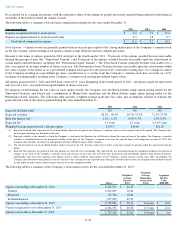
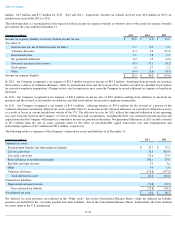
The following table is a summary of the Company’s stock appreciation rights activity for the year ended December 31, 2013 :
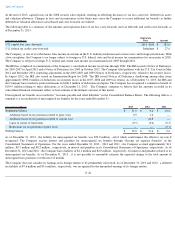
Note 13 — Income Taxes
The following table is a summary of the components of income (loss) before income taxes for the years ended December 31 :
Foreign income consists of statutory income and losses from the Company’s international subsidiaries. Most of the Company’
s wholly owned
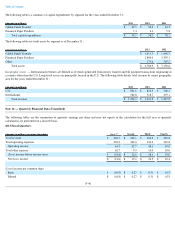
subsidiaries recognize revenue based solely on services agreements with the primary U.S. operating subsidiary. The following table is a
summary of the income tax expense (benefit) for the years ended December 31 :
As of December 31, 2013 and 2012 , the Company had a net income tax payable of $53.7 million and $52.3 million
, respectively, recorded in
the “Accounts payable and other liabilities” line in the Consolidated Balance Sheets. Income taxes paid were $8.0
F-40
(Dollars in millions) 2013
2012
2011
Market value of restricted stock units converted
$
0.8
$
0.6
$
0.6
Unrecognized restricted stock unit expense
$
9.5
Total
Shares
Weighted
Average
Price
Stock appreciation rights outstanding at December 31, 2012
8,600
$
17.03
Granted
4,743
17.00
Forfeited
(1,923
)
17.03
Stock appreciation rights outstanding at December 31, 2013
11,420
$
17.02
(Amounts in millions) 2013
2012
2011
U.S.
$
69.9
$
(9.6
)
$
39.7
Foreign
15.4
0.7
0.1
Income (loss) before income taxes
$
85.3
$
(8.9
)
$
39.8
(Amounts in millions) 2013
2012
2011
Current:
Federal
$
9.7
$
6.1
$
40.0
State
0.1
0.5
6.3
Foreign
11.1
4.0
6.9
Current income tax expense
20.9
10.6
53.2
Deferred income tax expense (benefit)
12.0
29.8
(72.8
)
Income tax expense (benefit)
$
32.9
$
40.4
$
(19.6
)