MoneyGram 2013 Annual Report Download - page 50
Download and view the complete annual report
Please find page 50 of the 2013 MoneyGram annual report below. You can navigate through the pages in the report by either clicking on the pages listed below, or by using the keyword search tool below to find specific information within the annual report.-
 1
1 -
2
-
3
-
4
-
5
-
6
-
7
-
8
-
9
-
10
-
11
-
12
-
13
-
14
-
15
-
16
-
17
-
18
-
19
-
20
-
21
-
22
-
23
-
24
-
25
-
26
-
27
-
28
-
29
-
30
-
31
-
32
-
33
-
34
-
35
-
36
-
37
-
38
-
39
-
 40
40 -
 41
41 -
 42
42 -
 43
43 -
 44
44 -
 45
45 -
 46
46 -
 47
47 -
 48
48 -
 49
49 -
 50
50 -
 51
51 -
 52
52 -
 53
53 -
 54
54 -
 55
55 -
 56
56 -
 57
57 -
 58
58 -
 59
59 -
 60
60 -
61
-
62
-
63
-
64
-
65
-
66
-
67
-
68
-
69
-
70
-
71
-
72
-
73
-
74
-
75
-
76
-
77
-
78
-
79
-
80
-
81
-
82
-
83
-
84
-
85
-
86
-
87
-
88
-
89
-
90
-
91
-
92
-
93
-
94
-
95
-
96
-
97
-
98
-
99
-
100
-
101
-
102
-
103
-
104
-
105
-
106
-
107
-
108
-
109
-
110
-
111
-
112
-
113
-
114
-
115
-
116
-
117
-
118
-
119
-
120
-
121
-
122
-
123
-
124
-
125
-
126
-
127
-
128
-
129
-
130
-
131
-
132
-
133
-
134
-
135
-
136
-
137
-
138
 |
 |

Table of Contents
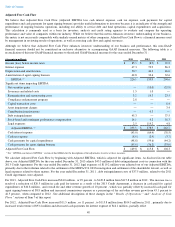
Adjusted Free Cash Flow
We believe that Adjusted Free Cash Flow (Adjusted EBITDA less cash interest expense, cash tax expense, cash payments for capital
expenditures and cash payments for agent signing bonuses) provides useful information to investors because it is an indicator of the strength and
performance of ongoing business operations, including our ability to service debt and fund operations, capital expenditures and acquisitions.
This calculation is commonly used as a basis for investors, analysts and credit rating agencies to evaluate and compare the operating
performance and value of companies within our industry. While we believe that this metric enhances investors' understanding of our business,
this metric is not necessarily comparable with similarly named metrics of other companies. Adjusted Free Cash Flow is a financial measure used
by management in reviewing results of operations, as well as assessing cash flow and capital resources.
Although we believe that Adjusted Free Cash Flow enhances investors' understanding of our business and performance, this non-
GAAP
financial measure should not be considered an exclusive alternative to accompanying GAAP financial measures. The following table is a
reconciliation of this non-GAAP financial measure to the related GAAP financial measure for the years ended December 31 :
(1)
See “ EBITDA and Adjusted EBITDA ” section of this MD&A for the descriptions of the adjustments to arrive at these measures.
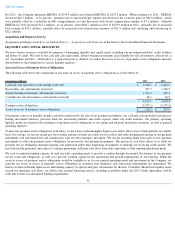
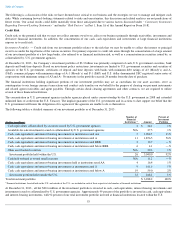
We calculate Adjusted Free Cash Flow by beginning with Adjusted EBITDA, which is adjusted for significant items. As disclosed in our table
above, our Adjusted EBITDA for the year ended December 31, 2013 adjusts $45.3 million
of debt extinguishment costs in connection with the
2013 Credit Agreement. For the year ended December 31, 2012 legal expenses of $119.2 million
were adjusted out of our Adjusted EBITDA,
primarily due to the forfeiture related to the settlement of the MDPA/U.S. DOJ investigation and settlement of the shareholder lawsuit, as well as
legal expenses related to these matters. For the year ended December 31, 2011 , debt extinguishment costs of $37.5 million
, related to the 2011
Credit Agreement, were adjusted.
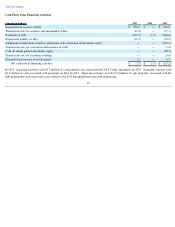
For 2013 , Adjusted Free Cash Flow increased $34.0 million , or 29 percent , to $149.8 million from $115.8 million in 2012
. The increase was a
result of a reduction of $20.5 million
in cash paid for interest as a result of the 2013 Credit Agreement, a decrease in cash paid for capital
expenditures of $10.8 million , and overall fee and other revenue growth of 10 percent
, which was partially offset by increased cash paid for
agent signing bonuses of $8.8 million and increased commissions expense as a percentage of fee and other revenue grew from 45.1 percent
to
46.5 percent , when compared to 2012 . See additional descriptions of these changes in the " Results of Operations " and "
Analysis of Cash
Flows
" sections of Item 7 of this report.
For 2012 , Adjusted Free Cash Flow increased $11.5 million , or 11 percent , to $115.8 million from $104.3 million in 2011
, primarily due to
increased total revenue of $93.4 million and decreased cash payments for interest expense of $14.1 million , partially offset
48
(Amounts in millions) 2013
2012
2011
Income (loss) before income taxes
$
85.3
$
(8.9
)
$
39.8
Interest expense
47.3
70.9
86.2
Depreciation and amortization
50.7
44.3
46.0
Amortization of agent signing bonuses
42.8
33.6
32.6
EBITDA
(1)
226.1
139.9
204.6
Significant items impacting EBITDA:
Net securities gains —
(
10.0
)
(32.8
)
Severance and related costs
1.5
1.0
—
Reorganization and restructuring costs
3.2
19.3
23.5
Compliance enhancement program
2.8
—
—
Capital transaction costs —
—
6.4
Asset impairment charges —
—
3.4
Contribution from investors —
0.3
—
Debt extinguishment
45.3
—
37.5
Stock-based and contingent performance compensation
14.1
9.2
16.3
Legal expenses
2.5
119.2
4.8
Adjusted EBITDA
(1)
$
295.5
$
278.9
$
263.7
Cash interest expense
(43.9
)
(64.4
)
(78.5
)
Cash tax expense
(8.0
)
(2.9
)
(3.7
)
Cash payments for capital expenditures
(48.8
)
(59.6
)
(44.2
)
Cash payments for agent signing bonuses
(45.0
)
(36.2
)
(33.0
)
Adjusted Free Cash Flow
$
149.8
$
115.8
$
104.3