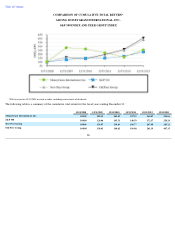
MoneyGram 2013 Annual Report Download - page 33
Download and view the complete annual report
Please find page 33 of the 2013 MoneyGram annual report below. You can navigate through the pages in the report by either clicking on the pages listed below, or by using the keyword search tool below to find specific information within the annual report.-
 1
1 -
2
-
3
-
4
-
5
-
6
-
7
-
8
-
9
-
10
-
11
-
12
-
13
-
14
-
15
-
16
-
17
-
18
-
19
-
20
-
21
-
22
-
 23
23 -
 24
24 -
 25
25 -
 26
26 -
 27
27 -
 28
28 -
 29
29 -
 30
30 -
 31
31 -
 32
32 -
 33
33 -
 34
34 -
 35
35 -
 36
36 -
 37
37 -
 38
38 -
 39
39 -
 40
40 -
 41
41 -
 42
42 -
 43
43 -
44
-
45
-
46
-
47
-
48
-
49
-
50
-
51
-
52
-
53
-
54
-
55
-
56
-
57
-
58
-
59
-
60
-
61
-
62
-
63
-
64
-
65
-
66
-
67
-
68
-
69
-
70
-
71
-
72
-
73
-
74
-
75
-
76
-
77
-
78
-
79
-
80
-
81
-
82
-
83
-
84
-
85
-
86
-
87
-
88
-
89
-
90
-
91
-
92
-
93
-
94
-
95
-
96
-
97
-
98
-
99
-
100
-
101
-
102
-
103
-
104
-
105
-
106
-
107
-
108
-
109
-
110
-
111
-
112
-
113
-
114
-
115
-
116
-
117
-
118
-
119
-
120
-
121
-
122
-
123
-
124
-
125
-
126
-
127
-
128
-
129
-
130
-
131
-
132
-
133
-
134
-
135
-
136
-
137
-
138
 |
 |

Table of Contents
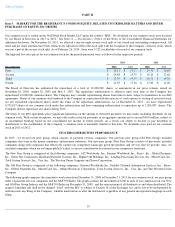
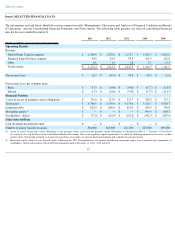
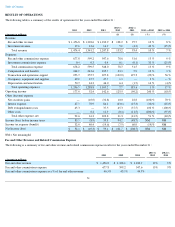
RESULTS OF OPERATIONS
The following table is a summary of the results of operations for the years ended December 31 :
NM = Not meaningful
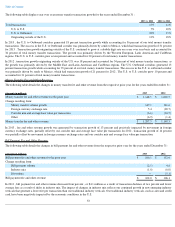
Fee and Other Revenue and Related Commission Expense
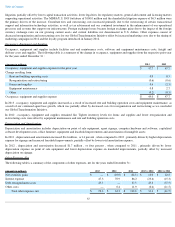
The following is a summary of fee and other revenue and related commission expense results for the years ended December 31 :
31
2013
2012
2011
2013 vs
2012
2012 vs
2011
2013 vs 2012
2012 vs 2011
(Amounts in millions)
($)
($)
(%)
(%)
Revenue
Fee and other revenue
$
1,456.8
$
1,328.6
$
1,230.9
$
128.2
$
97.7
10
%
8
%
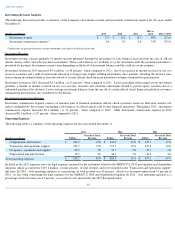
Investment revenue
17.6
12.6
16.9
5.0
(4.3
)
40
%
(25
)%
Total revenue
1,474.4
1,341.2
1,247.8
133.2
93.4
10
%
7
%
Expenses
Fee and other commissions expense
677.8
599.2
547.6
78.6
51.6
13
%
9
%
Investment commissions expense
0.4
0.3
0.4
0.1
(0.1
)
33
%
(25
)%
Total commissions expense
678.2
599.5
548.0
78.7
51.5
13
%
9
%
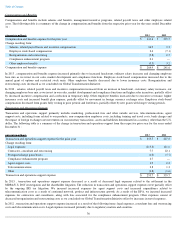
Compensation and benefits
264.9
241.6
235.7
23.3
5.9
10
%
3
%
Transaction and operations support
253.7
355.7
227.8
(102.0
)
127.9
(29
)%
56
%
Occupancy, equipment and supplies
49.0
47.7
47.7
1.3
—
3
%
—
%
Depreciation and amortization
50.7
44.3
46.0
6.4
(1.7
)
14
%
(4
)%
Total operating expenses
1,296.5
1,288.8
1,105.2
7.7
183.6
1
%
17
%
Operating income
177.9
52.4
142.6
125.5
(90.2
)
240
%
(63
)%
Other (income) expense
Net securities gains
—
(
10.0
)
(32.8
)
10.0
22.8
(100
)%
70
%
Interest expense
47.3
70.9
86.2
(23.6
)
(15.3
)
(33
)%
(18
)%
Debt extinguishment costs
45.3
—
37.5
45.3
(37.5
)
100
%
(100
)%
Other costs
—
0.4
11.9
(0.4
)
(11.5
)
(100
)%
(97
)%
Total other expense, net
92.6
61.3
102.8
31.3
(41.5
)
51
%
(40
)%
Income (loss) before income taxes
85.3
(8.9
)
39.8
94.2
(48.7
)
NM
NM
Income tax expense (benefit)
32.9
40.4
(19.6
)
(7.5
)
60.0
(19
)%
NM
Net Income (loss)
$
52.4
$
(49.3
)
$
59.4
$
101.7
$
(108.7
)
NM
NM
2013
2012
2011
2013 vs
2012
2012 vs
2011
(Amounts in millions)
Fee and other revenue
$
1,456.8
$
1,328.6
$
1,230.9
10
%
8
%
Fee and other commissions expense
677.8
599.2
547.6
13
%
9
%
Fee and other commissions expense as a % of fee and other revenue
46.5
%
45.1
%
44.5
%