MoneyGram 2013 Annual Report Download - page 90
Download and view the complete annual report
Please find page 90 of the 2013 MoneyGram annual report below. You can navigate through the pages in the report by either clicking on the pages listed below, or by using the keyword search tool below to find specific information within the annual report.-
 1
1 -
2
-
3
-
4
-
5
-
6
-
7
-
8
-
9
-
10
-
11
-
12
-
13
-
14
-
15
-
16
-
17
-
18
-
19
-
20
-
21
-
22
-
23
-
24
-
25
-
26
-
27
-
28
-
29
-
30
-
31
-
32
-
33
-
34
-
35
-
36
-
37
-
38
-
39
-
40
-
41
-
42
-
43
-
44
-
45
-
46
-
47
-
48
-
49
-
50
-
51
-
52
-
53
-
54
-
55
-
56
-
57
-
58
-
59
-
60
-
61
-
62
-
63
-
64
-
65
-
66
-
67
-
68
-
69
-
70
-
71
-
72
-
73
-
74
-
75
-
76
-
77
-
78
-
79
-
 80
80 -
 81
81 -
 82
82 -
 83
83 -
 84
84 -
 85
85 -
 86
86 -
 87
87 -
 88
88 -
 89
89 -
 90
90 -
 91
91 -
 92
92 -
 93
93 -
 94
94 -
 95
95 -
 96
96 -
 97
97 -
 98
98 -
 99
99 -
 100
100 -
101
-
102
-
103
-
104
-
105
-
106
-
107
-
108
-
109
-
110
-
111
-
112
-
113
-
114
-
115
-
116
-
117
-
118
-
119
-
120
-
121
-
122
-
123
-
124
-
125
-
126
-
127
-
128
-
129
-
130
-
131
-
132
-
133
-
134
-
135
-
136
-
137
-
138
 |
 |

Table of Contents
Available
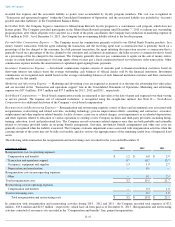
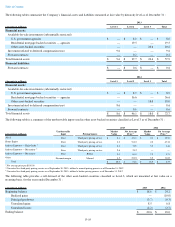
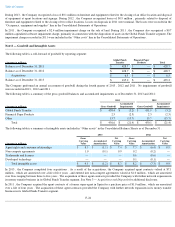
-for-sale Investments (substantially restricted) — Available-for-sale investments consist of mortgage-backed securities, other asset-
backed securities and agency debenture securities. The following is a summary of the amortized cost and fair value of available-for-
sale
investments as of December 31 :
(1)
Net average price is per $100.00
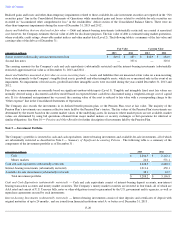
At December 31, 2013 and 2012 , approximately 57 percent and 71 percent , respectively, of the available-for-
sale portfolio were invested in
debentures of U.S. government agencies or securities collateralized by U.S. government agency debentures. These securities have the implicit
backing of the U.S. government, and the Company expects to receive full par value upon maturity or pay-
down, as well as all interest payments.
Included in other asset-backed securities are collateralized debt obligations backed primarily by high-
grade debt, mezzanine equity tranches of
collateralized debt obligations and home equity loans, along with private equity investments, as summarized in Note 4 —
Fair Value
Measurement
. The other asset-
backed securities continue to have market exposure, and this risk is factored into the fair value estimates of the
Company, with the average price of an asset-backed security at $0.05 per dollar of par at December 31, 2013 .
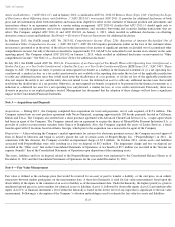
Gains and Losses and Other-Than-Temporary Impairments — At December 31, 2013 and 2012 , net unrealized gains of $17.3 million
and
$16.3 million , respectively, are included in the Consolidated Balance Sheets in “Accumulated other comprehensive loss.”
The following is a summary of “Net securities gains” for the years ended December 31 :
During 2012 , the Company disposed of two securities classified as other asset-backed securities with a fair value of $10.0 million
. These
securities had previously been written down to a nominal fair value, resulting in a realized gain of $10.0 million in 2012
and were reclassified
from “Accumulated other comprehensive loss” to “Net securities gains” in the Consolidated Statements of Operations. During 2011
, the
Company recognized settlements of $32.8 million equal to all of the outstanding principal from two securities classified as other asset-
backed
securities. These securities had previously been written down to a nominal fair value, resulting in a realized gain of $32.8 million
in 2011 and
were reclassified from "Accumulated other comprehensive loss" to “Net securities gains” in the Consolidated Statements of Operations.
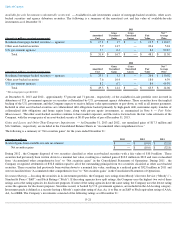
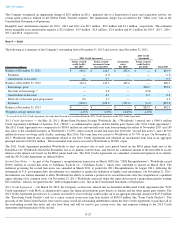
Investment Ratings
— In rating the securities in its investment portfolio, the Company uses ratings from Moody’s Investor Service (“Moody’s”
),
Standard & Poors (“S&P”) and Fitch Ratings (“Fitch”).
If the rating agencies have split ratings, the Company uses the highest two out of three
ratings across the rating agencies for disclosure purposes. If none of the rating agencies have the same rating, the Company uses the lowest rating
across the agencies for disclosure purposes. Securities issued, or backed by U.S. government agencies, are included in the AAA rating category.
Investment grade is defined as a security having a Moody’
s equivalent rating of Aaa, Aa, A or Baa or an S&P or Fitch equivalent rating of AAA,
AA, A or BBB. The Company’s investments consisted of the following ratings as of December 31 :
F-21
2013
(Amounts in millions, except net average price) Amortized
Cost
Gross
Unrealized
Gains
Gross
Unrealized
Losses
Fair
Value
Net
(1)
Average
Price
Residential mortgage-backed securities — agencies
$
17.8
$
1.7
$
—
$
19.5
$
110.45
Other asset-backed securities
5.9
14.7
—
20.6
5.24
U.S. government agencies
7.7
0.3
—
8.0
99.87
Total
$
31.4
$
16.7
$
—
$
48.1
$
11.50
2012
(Amounts in millions, except net average price) Amortized
Cost
Gross
Unrealized
Gains
Gross
Unrealized
Losses
Fair
Value
Net
(1)
Average
Price
Residential mortgage-backed securities — agencies
$
33.5
$
3.1
$
—
$
36.6
$
110.02
Other asset-backed securities
7.6
10.4
—
18.0
4.39
U.S. government agencies
8.2
0.7
—
8.9
99.39
Total
$
49.3
$
14.2
$
—
$
63.5
$
14.06
(Amounts in millions) 2013
2012
2011
Realized gains from available-for-sale investments
$
—
$
(
10.0
)
$
(32.8
)
Net securities gains
$
—
$
(
10.0
)
$
(32.8
)