MoneyGram 2013 Annual Report Download - page 40
Download and view the complete annual report
Please find page 40 of the 2013 MoneyGram annual report below. You can navigate through the pages in the report by either clicking on the pages listed below, or by using the keyword search tool below to find specific information within the annual report.
Table of Contents
Net Securities Gains
— During 2013 , we did not realize any net securities gains or losses. During 2012 , two securities classified as other asset-
backed securities were sold for a $10.0 million realized gain recognized in “Net securities gains”
in the Consolidated Statements of Operations.
These securities had previously been written down to a nominal fair value. In 2011 , net securities gains of $32.8 million
reflect the receipt of
settlements equal to all outstanding principal from two securities classified in other asset-
backed securities. These securities had previously been
written down to a nominal value.
Interest Expense
— As a result of lower interest rates from the 2013 Credit Agreement and Note Repurchase, interest expense in 2013
decreased
$23.6 million , from $70.9 million in 2012 to $47.3 million in 2013. Interest expense decreased to $70.9 million in 2012 , from $86.2 million
in
2011 , as a result of lower interest rates from our refinancing activities.
Debt Extinguishment Costs
—
In connection with the termination of the 2011 Credit Agreement and the Note Repurchase, we recognized debt
extinguishment costs of $45.3 million in the first quarter of 2013 . We expensed $20.0 million of unamortized deferred financing costs and
$2.3
million of debt discount and incurred $1.5 million of debt modification costs. Additionally, we incurred a prepayment penalty of
$21.5 million
for the Note Repurchase, which was expensed as debt extinguishment costs. We did not record debt extinguishment costs in 2012
. See Note 9
—
Debt of the Notes to the Consolidated Financial Statements for additional disclosure.
We recognized total debt extinguishment costs of $37.5 million in 2011
. In connection with the refinancing of our 2008 senior debt facility in
May 2011, we recorded $5.2 million of debt extinguishment costs, primarily from the write-
off of unamortized deferred financing costs. In
connection with the partial redemption of the second lien notes in November 2011,we incurred a prepayment penalty of $23.2 million and wrote-
off $9.1 million of unamortized deferred financing costs.
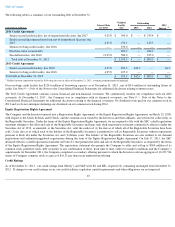
Other Costs — The following table is a summary of other costs, which include items deemed to be non-operating based on management’
s
assessment of the nature of the item in relation to our core operations for the years ended December 31 :
Capital transactions costs relate to the 2011 Recapitalization and the secondary offering. Loss on asset disposition relates to land sold as part of
our global business transformation and a former bill payment service. Asset impairments relate to land sold and intangible assets acquired in the
second quarter of 2011.
Income Taxes
In 2013 , the Company recognized a tax expense of $32.9 million on pre-tax income of $85.3 million
benefiting from proceeds on securities that
result in a release of valuation allowance offset by international taxes and the reversal of tax benefits recorded on canceled stock options for
executive employee terminations. Changes in facts and circumstances may cause the Company to record additional tax expense or benefits in the
future.
In 2012 , the Company recognized a tax expense of $40.4 million on pre-tax loss of $8.9 million
resulting from additions to uncertain tax
positions and the reversal of the tax benefits recorded on canceled stock options for separated employees.
In 2011 , the Company recognized a tax benefit of $19.6 million
, reflecting benefits of $34.0 million for the reversal of a portion of the
valuation allowance on domestic deferred tax assets and $9.7 million on the sale of assets. Partially offsetting the benefit is tax expense for non-
deductible reorganization and restructuring expenses and a valuation allowance on a portion of deferred tax assets as a result of losses in certain
jurisdictions outside of the U.S. The effective tax rate for 2011 reflects the expected utilization of net tax loss carry
-
forwards based on the
Company’
s review of current facts and circumstances, including the three year cumulative income position and expectations that the Company
will maintain a cumulative income position in the future.
38
(Amounts in millions) 2013
2012
2011
Other costs
Capital transaction costs
$
—
$
—
$
6.4
Loss on asset disposition —
0.1
1.0
Asset impairments —
—
4.5
Contribution from investors —
0.3
—
Total other costs, net
$
—
$
0.4
$
11.9


