MoneyGram 2013 Annual Report Download - page 73
Download and view the complete annual report
Please find page 73 of the 2013 MoneyGram annual report below. You can navigate through the pages in the report by either clicking on the pages listed below, or by using the keyword search tool below to find specific information within the annual report.-
 1
1 -
2
-
3
-
4
-
5
-
6
-
7
-
8
-
9
-
10
-
11
-
12
-
13
-
14
-
15
-
16
-
17
-
18
-
19
-
20
-
21
-
22
-
23
-
24
-
25
-
26
-
27
-
28
-
29
-
30
-
31
-
32
-
33
-
34
-
35
-
36
-
37
-
38
-
39
-
40
-
41
-
42
-
43
-
44
-
45
-
46
-
47
-
48
-
49
-
50
-
51
-
52
-
53
-
54
-
55
-
56
-
57
-
58
-
59
-
60
-
61
-
62
-
 63
63 -
 64
64 -
 65
65 -
 66
66 -
 67
67 -
 68
68 -
 69
69 -
 70
70 -
 71
71 -
 72
72 -
 73
73 -
 74
74 -
 75
75 -
 76
76 -
 77
77 -
 78
78 -
 79
79 -
 80
80 -
 81
81 -
 82
82 -
 83
83 -
84
-
85
-
86
-
87
-
88
-
89
-
90
-
91
-
92
-
93
-
94
-
95
-
96
-
97
-
98
-
99
-
100
-
101
-
102
-
103
-
104
-
105
-
106
-
107
-
108
-
109
-
110
-
111
-
112
-
113
-
114
-
115
-
116
-
117
-
118
-
119
-
120
-
121
-
122
-
123
-
124
-
125
-
126
-
127
-
128
-
129
-
130
-
131
-
132
-
133
-
134
-
135
-
136
-
137
-
138
 |
 |

Table of Contents
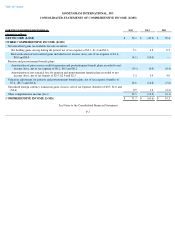
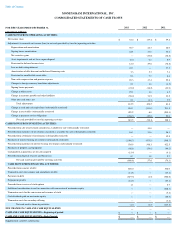
MONEYGRAM INTERNATIONAL, INC.
CONSOLIDATED STATEMENTS OF OPERATIONS
See Notes to the Consolidated Financial Statements
F-6
FOR THE YEAR ENDED DECEMBER 31, 2013
2012
2011
(Amounts in millions, except per share data)
REVENUE
Fee and other revenue
$
1,456.8
$
1,328.6
$
1,230.9
Investment revenue
17.6
12.6
16.9
Total revenue
1,474.4
1,341.2
1,247.8
EXPENSES
Fee and other commissions expense
677.8
599.2
547.6
Investment commissions expense
0.4
0.3
0.4
Total commissions expense
678.2
599.5
548.0
Compensation and benefits
264.9
241.6
235.7
Transaction and operations support
253.7
355.7
227.8
Occupancy, equipment and supplies
49.0
47.7
47.7
Depreciation and amortization
50.7
44.3
46.0
Total operating expenses
1,296.5
1,288.8
1,105.2
OPERATING INCOME
177.9
52.4
142.6
Other (income) expense
Net securities gains
—
(
10.0
)
(32.8
)
Interest expense
47.3
70.9
86.2
Debt extinguishment costs
45.3
—
37.5
Other costs
—
0.4
11.9
Total other expenses, net
92.6
61.3
102.8
Income (loss) before income taxes
85.3
(8.9
)
39.8
Income tax expense (benefit)
32.9
40.4
(19.6
)
NET INCOME (LOSS)
$
52.4
$
(49.3
)
$
59.4
BASIC INCOME (LOSS) PER COMMON SHARE
$
0.73
$
(0.69
)
$
(9.03
)
DILUTED INCOME (LOSS) PER COMMON SHARE
$
0.73
$
(0.69
)
$
(9.03
)
Net income (loss) available to common stockholders:
Net income (loss) as reported
$
52.4
$
(49.3
)
$
59.4
Accrued dividends on mezzanine equity
—
—
(
30.9
)
Accretion on mezzanine equity
—
—
(
80.0
)
Additional consideration issued in connection with conversion of mezzanine equity
—
—
(
366.8
)
Cash dividends paid on mezzanine equity
—
—
(
20.5
)
Net income (loss) available to common stockholders
$
52.4
$
(49.3
)
$
(438.8
)
Weighted-average outstanding common shares and equivalents — basic
71.6
71.5
48.6
Weighted-average outstanding common shares and equivalents — diluted
71.9
71.5
48.6