MoneyGram 2013 Annual Report Download - page 87
Download and view the complete annual report
Please find page 87 of the 2013 MoneyGram annual report below. You can navigate through the pages in the report by either clicking on the pages listed below, or by using the keyword search tool below to find specific information within the annual report.-
 1
1 -
2
-
3
-
4
-
5
-
6
-
7
-
8
-
9
-
10
-
11
-
12
-
13
-
14
-
15
-
16
-
17
-
18
-
19
-
20
-
21
-
22
-
23
-
24
-
25
-
26
-
27
-
28
-
29
-
30
-
31
-
32
-
33
-
34
-
35
-
36
-
37
-
38
-
39
-
40
-
41
-
42
-
43
-
44
-
45
-
46
-
47
-
48
-
49
-
50
-
51
-
52
-
53
-
54
-
55
-
56
-
57
-
58
-
59
-
60
-
61
-
62
-
63
-
64
-
65
-
66
-
67
-
68
-
69
-
70
-
71
-
72
-
73
-
74
-
75
-
76
-
 77
77 -
 78
78 -
 79
79 -
 80
80 -
 81
81 -
 82
82 -
 83
83 -
 84
84 -
 85
85 -
 86
86 -
 87
87 -
 88
88 -
 89
89 -
 90
90 -
 91
91 -
 92
92 -
 93
93 -
 94
94 -
 95
95 -
 96
96 -
 97
97 -
98
-
99
-
100
-
101
-
102
-
103
-
104
-
105
-
106
-
107
-
108
-
109
-
110
-
111
-
112
-
113
-
114
-
115
-
116
-
117
-
118
-
119
-
120
-
121
-
122
-
123
-
124
-
125
-
126
-
127
-
128
-
129
-
130
-
131
-
132
-
133
-
134
-
135
-
136
-
137
-
138
 |
 |
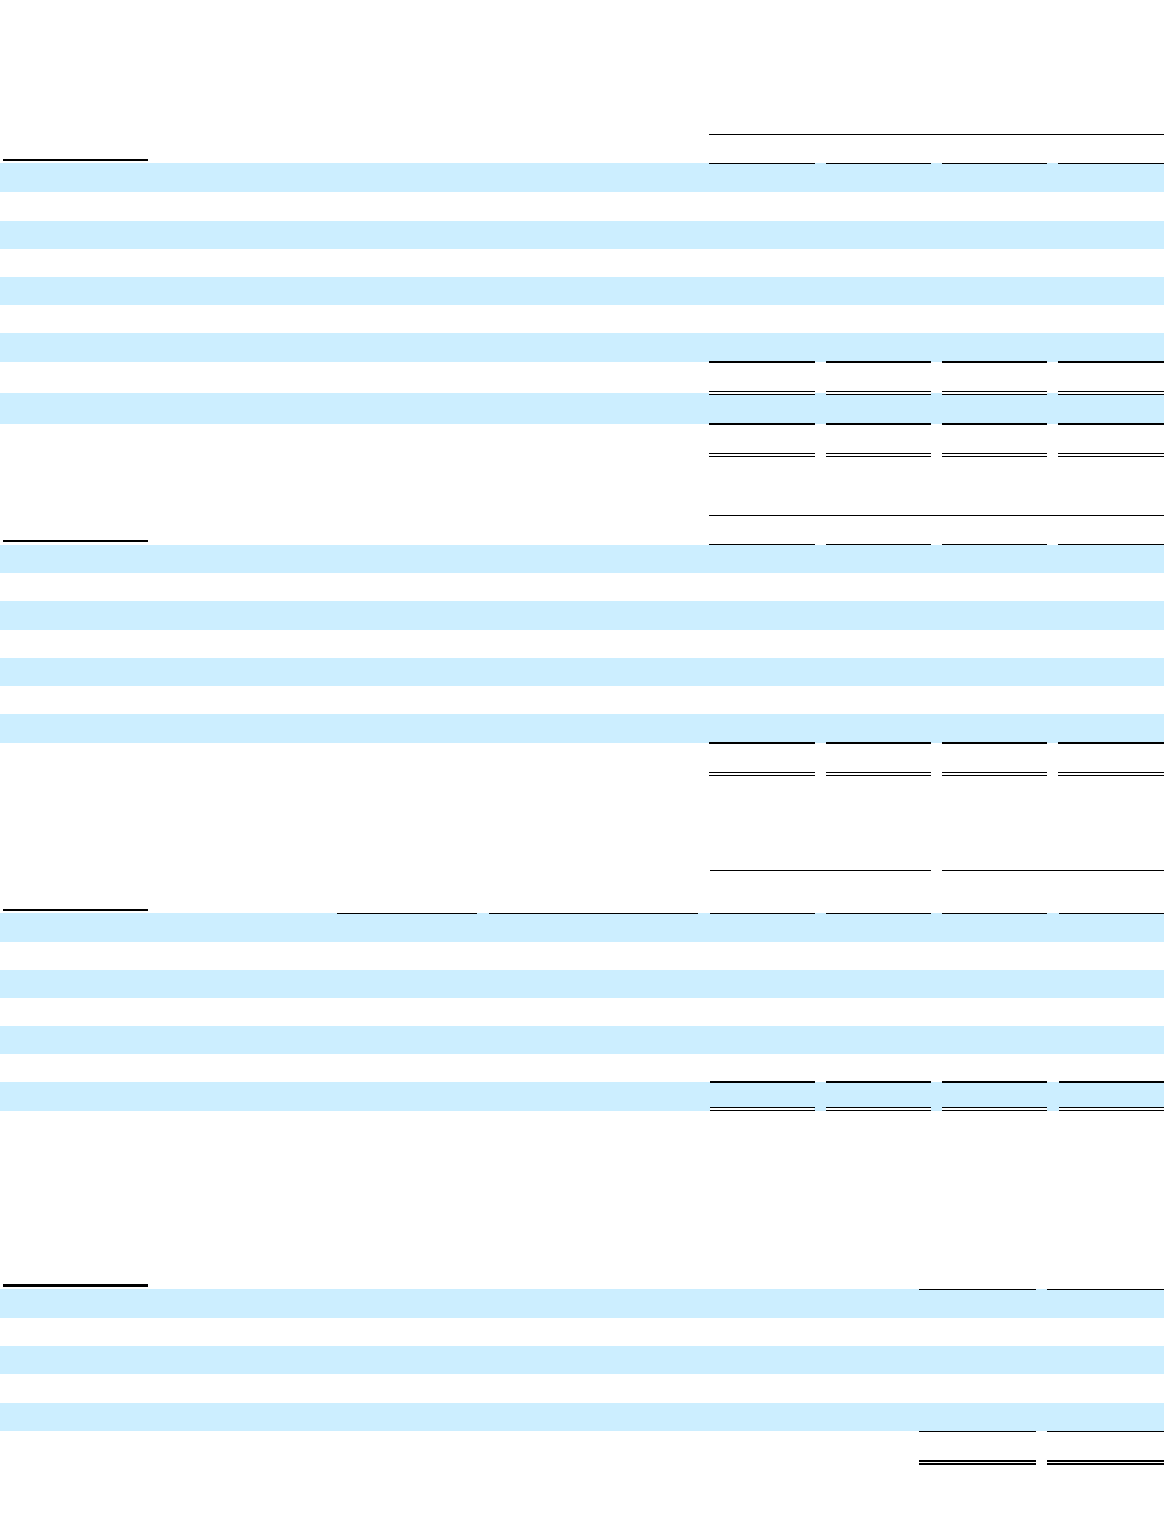
Table of Contents
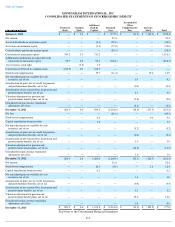
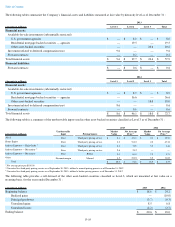
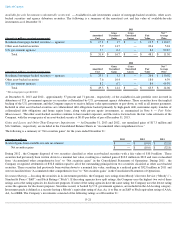
The following tables summarize the Company’s financial assets and liabilities measured at fair value by hierarchy level as of December 31 :
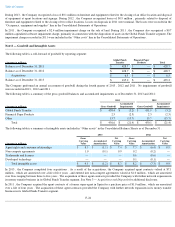
The following table is a summary of the unobservable inputs used in other asset-backed securities classified as Level 3 as of December 31 :
(1)
Net average price per $100.00
(2)
Converted to a third party pricing service as of September 30, 2013; utilized a manual pricing process as of December 31, 2012
(3)
Converted to a third party pricing service as of September 30, 2013; utilized a broker pricing process as of December 31, 2012
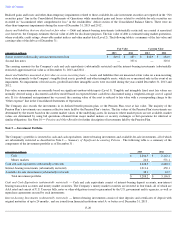
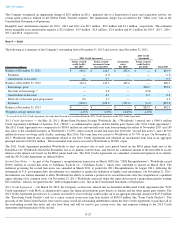
The following table provides a roll-forward of the other asset-
backed securities classified as Level 3, which are measured at fair value on a
recurring basis, for the years ended December 31 :
F-19
2013
(Amounts in millions) Level 1
Level 2
Level 3
Total
Financial assets:
Available-for-sale investments (substantially restricted):
U.S. government agencies
$
—
$
8.0
$
—
$
8.0
Residential mortgage-backed securities — agencies
—
19.5
—
19.5
Other asset-backed securities
—
—
20.6
20.6
Investment related to deferred compensation trust
9.6
—
—
9.6
Forward contracts
—
0.2
—
0.2
Total financial assets
$
9.6
$
27.7
$
20.6
$
57.9
Financial liabilities:
Forward contracts
$
—
$
0.6
$
—
$
0.6
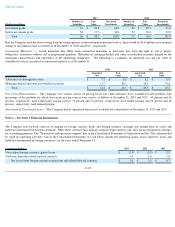
2012
(Amounts in millions) Level 1
Level 2
Level 3
Total
Financial assets:
Available-for-sale investments (substantially restricted):
U.S. government agencies
$
—
$
8.9
$
—
$
8.9
Residential mortgage-backed securities — agencies
—
36.6
—
36.6
Other asset-backed securities
—
—
18.0
18.0
Investment related to deferred compensation trust
8.6
—
—
8.6
Forward contracts
—
0.6
—
0.6
Total financial assets
$
8.6
$
46.1
$
18.0
$
72.7
2013
2012
(Amounts in millions) Unobservable
Input
Pricing Source
Market
Value
Net Average
Price
(1)
Market
Value
Net Average
Price
(1)
Alt-A Price
Third party pricing service
$
0.1
$
17.01
$
0.1
$
12.50
Home Equity Price
Third party pricing service
0.2
51.87
0.2
47.30
Indirect Exposure — High Grade
(2)
Price
Third party pricing service
8.2
7.90
3.9
3.46
Indirect Exposure — Mezzanine
(3)
Price
Third party pricing service
2.6
2.12
—
—
Indirect Exposure — Mezzanine Price
Broker
5.0
6.01
7.9
3.71
Other Discount margin
Manual
4.5
23.85
5.9
31.69
Total
$
20.6
$
5.24
$
18.0
$
4.39
(Amounts in millions) 2013
2012
Beginning balance
$
18.0
$
24.2
Realized gains
—
(
10.0
)
Principal paydowns
(3.7
)
(0.3
)
Unrealized gains
8.5
6.8
Unrealized losses
(2.2
)
(2.7
)
Ending balance
$
20.6
$
18.0