MoneyGram 2013 Annual Report Download - page 41
Download and view the complete annual report
Please find page 41 of the 2013 MoneyGram annual report below. You can navigate through the pages in the report by either clicking on the pages listed below, or by using the keyword search tool below to find specific information within the annual report.-
 1
1 -
2
-
3
-
4
-
5
-
6
-
7
-
8
-
9
-
10
-
11
-
12
-
13
-
14
-
15
-
16
-
17
-
18
-
19
-
20
-
21
-
22
-
23
-
24
-
25
-
26
-
27
-
28
-
29
-
30
-
 31
31 -
 32
32 -
 33
33 -
 34
34 -
 35
35 -
 36
36 -
 37
37 -
 38
38 -
 39
39 -
 40
40 -
 41
41 -
 42
42 -
 43
43 -
 44
44 -
 45
45 -
 46
46 -
 47
47 -
 48
48 -
 49
49 -
 50
50 -
 51
51 -
52
-
53
-
54
-
55
-
56
-
57
-
58
-
59
-
60
-
61
-
62
-
63
-
64
-
65
-
66
-
67
-
68
-
69
-
70
-
71
-
72
-
73
-
74
-
75
-
76
-
77
-
78
-
79
-
80
-
81
-
82
-
83
-
84
-
85
-
86
-
87
-
88
-
89
-
90
-
91
-
92
-
93
-
94
-
95
-
96
-
97
-
98
-
99
-
100
-
101
-
102
-
103
-
104
-
105
-
106
-
107
-
108
-
109
-
110
-
111
-
112
-
113
-
114
-
115
-
116
-
117
-
118
-
119
-
120
-
121
-
122
-
123
-
124
-
125
-
126
-
127
-
128
-
129
-
130
-
131
-
132
-
133
-
134
-
135
-
136
-
137
-
138
 |
 |
Table of Contents
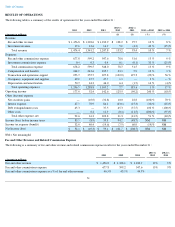
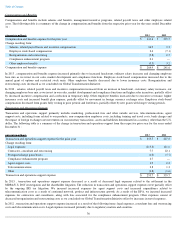
Pre-Tax Operating Income and Operating Margin
The Company's management utilizes pre-
tax operating income and operating margin when assessing both consolidated and segment operating
performance and allocation of resources. Excluded from the segments' operating income are interest and other expenses related to our credit
agreements, items related to our preferred stock, operating loss from businesses categorized as “Other,”
certain pension and benefit obligation
expenses, director deferred compensation plan expenses, executive severance and related costs and certain legal and corporate costs not related
to the performance of the segments.
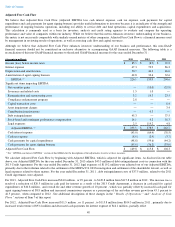
The following table provides a summary of pre-tax operating income and operating margin for the years ended December 31 :
“Other” expenses in 2013 included $2.5 million
of legal expenses in connection with the settlement related to the MDPA/U.S. DOJ investigation
and the shareholder litigation, $1.5 million
of severance and related costs from executive terminations as well as other net corporate costs of
$11.6 million not allocated to the segments. “Other” expenses in 2012 included $119.2 million
of legal expenses for the settlement in connection
with the MDPA/U.S. DOJ investigation and the shareholder litigation, $1.0 million
of severance and related costs from executive terminations as
well as other net corporate costs of $7.6 million not allocated to the segments. “Other” expenses in 2011 included $4.8 million
of legal
settlements and related costs for securities litigation associated with the Company's 2011 Recapitalization, $0.3 million
of asset impairments and
other net corporate costs of $4.8 million not allocated to the segments.
In 2013 , the Company experienced total operating income growth and improved total operating margin when compared to 2012
, as total
operating income increased to $177.9 million , from $52.4 million for the same period in 2012
. The growth was primarily driven by the
reduction of legal expenses, primarily resulting from
the settlement related to the MDPA/U.S. DOJ investigation and the shareholder litigation.
The Global Funds transfer segment generated operating income growth of $13.0 million
, which was partially offset by a decline in operating
income of $1.8 million from the Financial Paper Product segment.
In 2012
, as a result of the settlement related to the MDPA/U.S. DOJ investigation and the shareholder litigation, the Company experienced a
decline for both total operating income and total operating margins when compared to 2011 . Total operating income for 2012 was
$52.4
million , down from $142.6 million for the same period in 2011
. The Company experienced operating income growth from the Global Funds
Transfer segment and the Financial Paper Product segment of $24.8 million and $3.5 million , respectively.
39
(Amounts in millions) 2013
2012
2011
Operating income:
Global Funds Transfer
$
162.6
$
149.6
$
124.8
Financial Paper Products
30.9
32.7
29.2
Total segment operating income
193.5
182.3
154.0
Other
(15.6
)
(129.9
)
(11.4
)
Total operating income
177.9
52.4
142.6
Net securities gains
—
(
10.0
)
(32.8
)
Interest expense
47.3
70.9
86.2
Debt extinguishment costs
45.3
—
37.5
Other costs
—
0.4
11.9
Income (loss) before income taxes
$
85.3
$
(8.9
)
$
39.8
Total operating margin
12.1
%
3.9
%
11.4
%
Global Funds Transfer
11.7
%
11.9
%
10.8
%
Financial Paper Products
36.8
%
38.7
%
31.3
%