MoneyGram 2013 Annual Report Download - page 27
Download and view the complete annual report
Please find page 27 of the 2013 MoneyGram annual report below. You can navigate through the pages in the report by either clicking on the pages listed below, or by using the keyword search tool below to find specific information within the annual report.-
 1
1 -
2
-
3
-
4
-
5
-
6
-
7
-
8
-
9
-
10
-
11
-
12
-
13
-
14
-
15
-
16
-
 17
17 -
 18
18 -
 19
19 -
 20
20 -
 21
21 -
 22
22 -
 23
23 -
 24
24 -
 25
25 -
 26
26 -
 27
27 -
 28
28 -
 29
29 -
 30
30 -
 31
31 -
 32
32 -
 33
33 -
 34
34 -
 35
35 -
 36
36 -
 37
37 -
38
-
39
-
40
-
41
-
42
-
43
-
44
-
45
-
46
-
47
-
48
-
49
-
50
-
51
-
52
-
53
-
54
-
55
-
56
-
57
-
58
-
59
-
60
-
61
-
62
-
63
-
64
-
65
-
66
-
67
-
68
-
69
-
70
-
71
-
72
-
73
-
74
-
75
-
76
-
77
-
78
-
79
-
80
-
81
-
82
-
83
-
84
-
85
-
86
-
87
-
88
-
89
-
90
-
91
-
92
-
93
-
94
-
95
-
96
-
97
-
98
-
99
-
100
-
101
-
102
-
103
-
104
-
105
-
106
-
107
-
108
-
109
-
110
-
111
-
112
-
113
-
114
-
115
-
116
-
117
-
118
-
119
-
120
-
121
-
122
-
123
-
124
-
125
-
126
-
127
-
128
-
129
-
130
-
131
-
132
-
133
-
134
-
135
-
136
-
137
-
138
 |
 |

Table of Contents
PART II
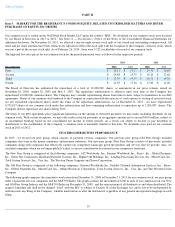
Item 5. MARKET FOR THE REGISTRANT’S COMMON EQUITY, RELATED STOCKHOLDER MATTERS AND ISSUER
PURCHASES OF EQUITY SECURITIES
Our common stock is traded on the NASDAQ Stock Market LLC under the symbol “MGI”.
No dividends on our common stock were declared
by our Board of Directors in 2013 or 2012 . See Note 11 — Stockholders’ Deficit
of the Notes to the Consolidated Financial Statements for
additional disclosure. On November 14, 2011, we effected a one-for-
eight reverse stock split of our issued and outstanding common stock. All
share and per share amounts have been retroactively adjusted to reflect the stock split with the exception of the Company’
s treasury stock, which
was not a part of the reverse stock split. As of February 26, 2014 , there were 9,722 stockholders of record of our common stock.
The high and low sales prices for our common stock for the periods presented were as follows for the respective periods:
The Board of Directors has authorized the repurchase of a total of 12,000,000
shares, as announced in our press releases issued on
November 18, 2004, August 18, 2005 and May 9, 2007. The repurchase authorization is effective until such time as the Company has
repurchased 12,000,000 common shares. The Company may consider repurchasing shares from time-to-
time, subject to limitations in our debt
agreements. Shares of our common stock tendered to the Company in connection with the exercise of stock options or vesting of restricted stock
are not considered repurchased shares under the terms of the repurchase authorization. As of December 31, 2013
, we have repurchased
6,795,017 shares of our common stock under this authorization and have remaining authorization to repurchase up to 5,204,983
shares. The
Company did not repurchase any shares during 2013.
The terms of our debt agreements place significant limitations on the amount of restricted payments we may make, including dividends on our
common stock. With certain exceptions, we may only make restricted payments in an aggregate amount not to exceed $50.0 million, subject to
an incremental build-
up based on our consolidated net income in future periods. As a result, our ability to declare or pay dividends or
distributions to the stockholders of the Company’
s common stock is materially limited at this time. No dividends were paid on our common
stock in 2013 or 2012 .
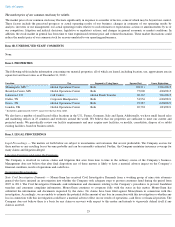
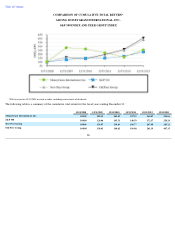
STOCKHOLDER RETURN PERFORMANCE
In 2013
, we revised our peer group, which consists of payment services companies. Our previous peer group (Old Peer Group) included
companies that were in the money remittance and payment industries. Our new peer group (New Peer Group) consists of previously included
companies along with companies that effectively capture our competitive landscape given the products and services that we provide. Also, we
excluded companies which are no longer publicly traded, or are not considered to be relevant in our competitive landscape.
The New Peer Group is comprised of the following companies: ACI Worldwide, Inc., Euronet Worldwide Inc., Fiserv, Inc., Global Payments
Inc., Green Dot Corporation, Heartland Payment Systems, Inc., Higher One Holdings, Inc., Lending Processing Services, Inc., MasterCard, Inc.,
Total System Services, Inc., Visa, Inc., The Western Union Company and Xoom Corporation.
The Old Peer Group is comprised of the following companies: Euronet Worldwide Inc., Fidelity National Information Services, Inc., Fiserv,
Inc., Global Payments Inc., MasterCard, Inc., Online Resources Corporation, Total System Services, Inc., Visa, Inc. and The Western Union
Company.
The following graph compares the cumulative total return from December 31, 2008 to December 31, 2013
for our common stock, our peer group
index of payment services companies and the S&P 500 Index. The graph assumes the investment of $100 in each of our common stock, our New
and Old Peer Group Indexes and the S&P 500 Index on December 31, 2008
, and the reinvestment of all dividends as and when distributed. The
graph is furnished and shall not be deemed “filed”
with the SEC or subject to Section 18 of the Exchange Act, and is not to be incorporated by
reference into any filing of the Company, whether made before or after the date hereof, regardless of any general incorporation language in such
filing.
25
2013
2012
Fiscal Quarter High
Low
High
Low
First
$
18.11
$
13.17
$
19.50
$
16.64
Second
$
24.88
$
15.79
$
18.10
$
13.66
Third
$
23.39
$
19.34
$
16.71
$
14.30
Fourth
$
21.95
$
17.36
$
17.80
$
11.00