MoneyGram 2013 Annual Report Download - page 92
Download and view the complete annual report
Please find page 92 of the 2013 MoneyGram annual report below. You can navigate through the pages in the report by either clicking on the pages listed below, or by using the keyword search tool below to find specific information within the annual report.-
 1
1 -
2
-
3
-
4
-
5
-
6
-
7
-
8
-
9
-
10
-
11
-
12
-
13
-
14
-
15
-
16
-
17
-
18
-
19
-
20
-
21
-
22
-
23
-
24
-
25
-
26
-
27
-
28
-
29
-
30
-
31
-
32
-
33
-
34
-
35
-
36
-
37
-
38
-
39
-
40
-
41
-
42
-
43
-
44
-
45
-
46
-
47
-
48
-
49
-
50
-
51
-
52
-
53
-
54
-
55
-
56
-
57
-
58
-
59
-
60
-
61
-
62
-
63
-
64
-
65
-
66
-
67
-
68
-
69
-
70
-
71
-
72
-
73
-
74
-
75
-
76
-
77
-
78
-
79
-
80
-
81
-
 82
82 -
 83
83 -
 84
84 -
 85
85 -
 86
86 -
 87
87 -
 88
88 -
 89
89 -
 90
90 -
 91
91 -
 92
92 -
 93
93 -
 94
94 -
 95
95 -
 96
96 -
 97
97 -
 98
98 -
 99
99 -
 100
100 -
 101
101 -
 102
102 -
103
-
104
-
105
-
106
-
107
-
108
-
109
-
110
-
111
-
112
-
113
-
114
-
115
-
116
-
117
-
118
-
119
-
120
-
121
-
122
-
123
-
124
-
125
-
126
-
127
-
128
-
129
-
130
-
131
-
132
-
133
-
134
-
135
-
136
-
137
-
138
 |
 |
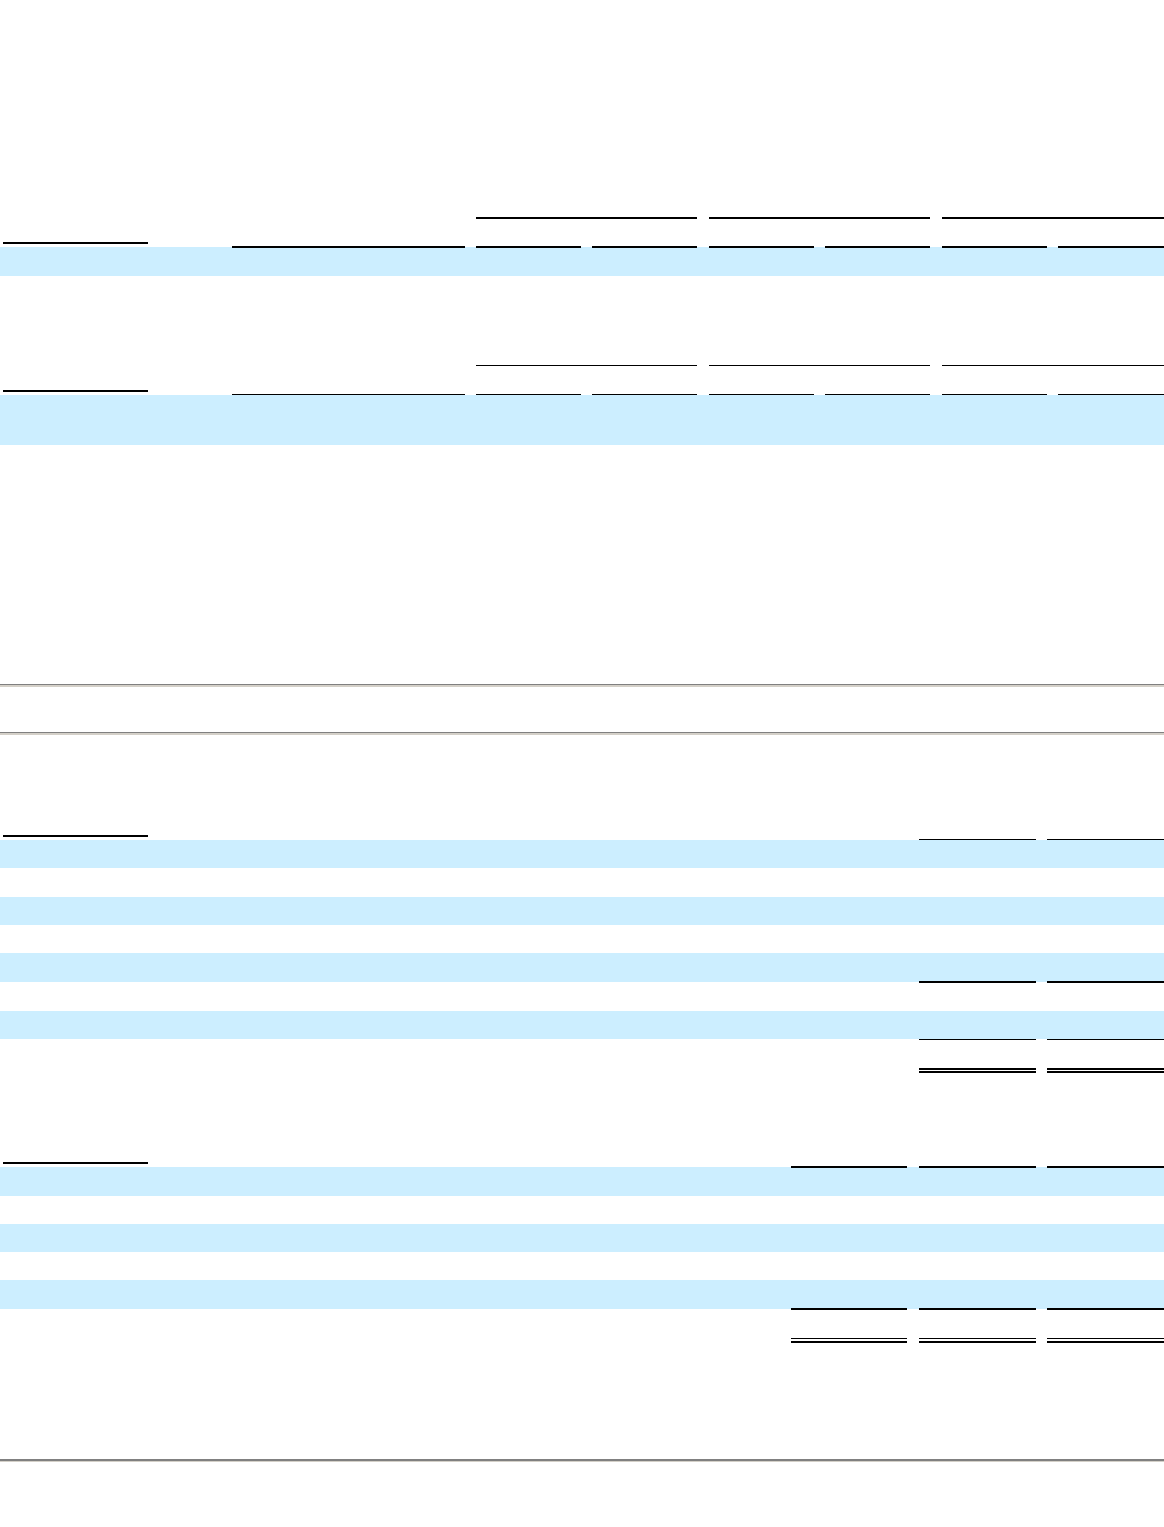
Table of Contents
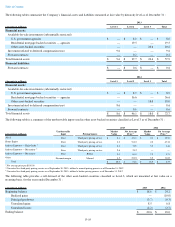
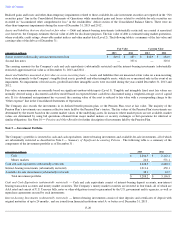
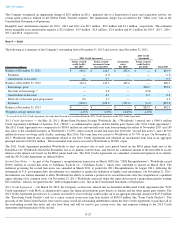
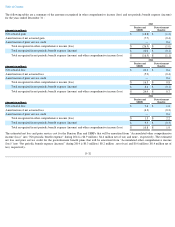
As of December 31, 2013 and 2012 , the Company had $129.0 million and $173.0 million
, respectively, of outstanding notional amounts
relating to its forward contracts. As of December 31, 2013 and 2012
, the Company reflected the following fair values of derivative forward
contract instruments in its Consolidated Balance Sheets:
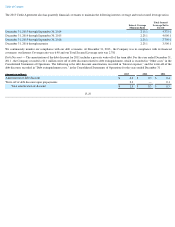
The Company's forward contracts are primarily executed with counterparties governed by an International Swaps and Derivatives Association
agreement that generally include standard netting arrangements. Hence, asset and liability positions from forward contracts and all other foreign
exchange transactions with the same counterparty are net settled upon maturity.
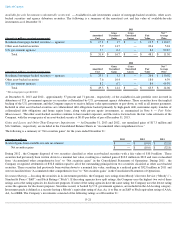
The Company is exposed to credit loss in the event of non-
performance by counterparties to its derivative contracts. The Company actively
monitors its exposure to credit risk through the use of credit approvals and credit limits, and by selecting major international banks and financial
institutions as counterparties. Collateral generally is not required of the counterparties or of the Company. In the unlikely event the counterparty
fails to meet the contractual terms of the derivative contract, the Company’
s risk is limited to the fair value of the instrument. The Company has
not had any historical instances of non-performance by any counterparties, nor does it anticipate any future instances of non-performance.
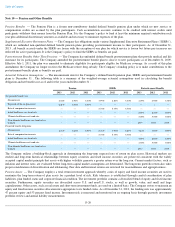
Note 7 — Property and Equipment
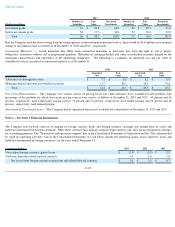
The following table is a summary of property and equipment as of December 31 :
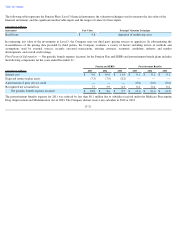
The following table is a summary of depreciation expense for the years ended December 31 :
At December 31, 2013 and 2012 , there was $14.9 million and $7.0 million
, respectively, of property and equipment that had been received by
the Company and included in “Accounts payable and other liabilities” in the Consolidated Balance Sheets.
F-23
Gross Amount of Recognized
Assets
Gross Amount of Offset
Net Amount of Assets
Presented in the Consolidated
Balance Sheets
(Amounts in millions) Balance Sheet Location
2013
2012
2013
2012
2013
2012
Forward contracts Other assets
$
0.4
$
0.7
$
(0.2
)
$
(0.1
)
$
0.2
$
0.6
Gross Amount of Recognized
Liabilities
Gross Amount of Offset
Net Amount of Liabilities
Presented in the Consolidated
Balance Sheets
(Amounts in millions) Balance Sheet Location
2013
2012
2013
2012
2013
2012
Forward contracts Accounts payable and other
liabilities
$
(0.8
)
$
(0.1
)
$
0.2
$
0.1
$
(0.6
)
$
—
(Amounts in millions) 2013
2012
Computer hardware and software
$
215.8
$
204.5
Signage
90.6
94.5
Equipment at agent locations
74.8
72.1
Office furniture and equipment
33.0
37.5
Leasehold improvements
28.5
26.4
Total property and equipment
442.7
435.0
Accumulated depreciation
(307.9
)
(307.1
)
Total property and equipment, net
$
134.8
$
127.9
(Amounts in millions) 2013
2012
2011
Computer hardware and software
$
23.2
$
20.8
$
21.1
Signage
14.9
12.1
9.6
Equipment at agent locations
4.6
4.3
6.5
Office furniture and equipment
3.8
3.7
4.0
Leasehold improvements
3.5
2.5
3.7
Total depreciation expense
$
50.0
$
43.4
$
44.9