MoneyGram 2013 Annual Report Download - page 117
Download and view the complete annual report
Please find page 117 of the 2013 MoneyGram annual report below. You can navigate through the pages in the report by either clicking on the pages listed below, or by using the keyword search tool below to find specific information within the annual report.-
 1
1 -
2
-
3
-
4
-
5
-
6
-
7
-
8
-
9
-
10
-
11
-
12
-
13
-
14
-
15
-
16
-
17
-
18
-
19
-
20
-
21
-
22
-
23
-
24
-
25
-
26
-
27
-
28
-
29
-
30
-
31
-
32
-
33
-
34
-
35
-
36
-
37
-
38
-
39
-
40
-
41
-
42
-
43
-
44
-
45
-
46
-
47
-
48
-
49
-
50
-
51
-
52
-
53
-
54
-
55
-
56
-
57
-
58
-
59
-
60
-
61
-
62
-
63
-
64
-
65
-
66
-
67
-
68
-
69
-
70
-
71
-
72
-
73
-
74
-
75
-
76
-
77
-
78
-
79
-
80
-
81
-
82
-
83
-
84
-
85
-
86
-
87
-
88
-
89
-
90
-
91
-
92
-
93
-
94
-
95
-
96
-
97
-
98
-
99
-
100
-
101
-
102
-
103
-
104
-
105
-
106
-
 107
107 -
 108
108 -
 109
109 -
 110
110 -
 111
111 -
 112
112 -
 113
113 -
 114
114 -
 115
115 -
 116
116 -
 117
117 -
 118
118 -
 119
119 -
 120
120 -
 121
121 -
 122
122 -
 123
123 -
 124
124 -
 125
125 -
 126
126 -
 127
127 -
128
-
129
-
130
-
131
-
132
-
133
-
134
-
135
-
136
-
137
-
138
 |
 |

Table of Contents
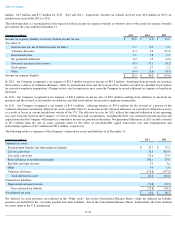
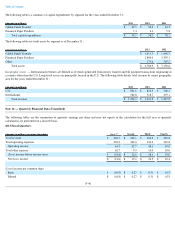
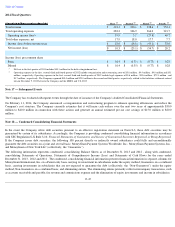
The following table is a summary of capital expenditures by segment for the years ended December 31 :
The following table sets forth assets by segment as of December 31 :
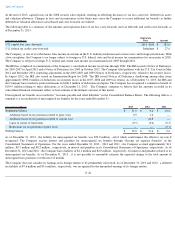
Geographic areas —
International revenues are defined as revenues generated from money transfer and bill payment transactions originating in
a country other than the U.S. Long-
lived assets are principally located in the U.S. The following table details total revenue by major geographic
area for the years ended December 31 :
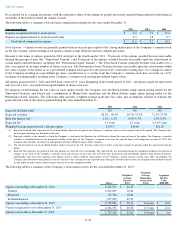
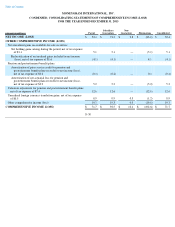
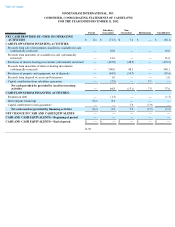
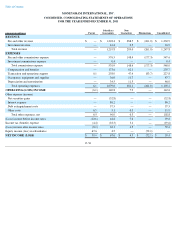
Note 16 — Quarterly Financial Data (Unaudited)
The following tables are the summation of quarterly earnings per share and may not equate to the calculation for the full year as quarterly
calculations are performed on a discrete basis.
2013 Fiscal Quarters:
F-46
(Amounts in millions) 2013
2012
2011
Global Funds Transfer
$
49.3
$
50.6
$
44.3
Financial Paper Products
7.4
6.1
5.8
Total capital expenditures
$
56.7
$
56.7
$
50.1
(Amounts in millions) 2013
2012
Global Funds Transfer
$
1,611.3
$
1,448.3
Financial Paper Products
2,800.0
3,395.1
Other
375.6
307.2
Total assets
$
4,786.9
$
5,150.6
(Amounts in millions) 2013
2012
2011
U.S.
$
891.6
$
822.5
$
768.7
International
582.8
518.7
479.1
Total revenue
$
1,474.4
$
1,341.2
$
1,247.8
(Amounts in millions, except per share data)
First
(1)
Second
Third
Fourth
Total revenue
$
340.5
$
365.1
$
383.0
$
385.8
Total operating expenses
296.2
322.6
334.9
342.8
Operating income
44.3
42.5
48.1
43.0
Total other expense
62.7
9.9
10.0
10.0
(Loss) income before income taxes
$
(18.4
)
$
32.6
$
38.1
$
33.0
Net (loss) income
$
(12.6
)
$
19.1
$
22.5
$
23.4
(Loss) income per common share
Basic
$
(0.18
)
$
0.27
$
0.31
$
0.33
Diluted
$
(0.18
)
$
0.27
$
0.31
$
0.33