MoneyGram 2013 Annual Report Download - page 48
Download and view the complete annual report
Please find page 48 of the 2013 MoneyGram annual report below. You can navigate through the pages in the report by either clicking on the pages listed below, or by using the keyword search tool below to find specific information within the annual report.-
 1
1 -
2
-
3
-
4
-
5
-
6
-
7
-
8
-
9
-
10
-
11
-
12
-
13
-
14
-
15
-
16
-
17
-
18
-
19
-
20
-
21
-
22
-
23
-
24
-
25
-
26
-
27
-
28
-
29
-
30
-
31
-
32
-
33
-
34
-
35
-
36
-
37
-
 38
38 -
 39
39 -
 40
40 -
 41
41 -
 42
42 -
 43
43 -
 44
44 -
 45
45 -
 46
46 -
 47
47 -
 48
48 -
 49
49 -
 50
50 -
 51
51 -
 52
52 -
 53
53 -
 54
54 -
 55
55 -
 56
56 -
 57
57 -
 58
58 -
59
-
60
-
61
-
62
-
63
-
64
-
65
-
66
-
67
-
68
-
69
-
70
-
71
-
72
-
73
-
74
-
75
-
76
-
77
-
78
-
79
-
80
-
81
-
82
-
83
-
84
-
85
-
86
-
87
-
88
-
89
-
90
-
91
-
92
-
93
-
94
-
95
-
96
-
97
-
98
-
99
-
100
-
101
-
102
-
103
-
104
-
105
-
106
-
107
-
108
-
109
-
110
-
111
-
112
-
113
-
114
-
115
-
116
-
117
-
118
-
119
-
120
-
121
-
122
-
123
-
124
-
125
-
126
-
127
-
128
-
129
-
130
-
131
-
132
-
133
-
134
-
135
-
136
-
137
-
138
 |
 |
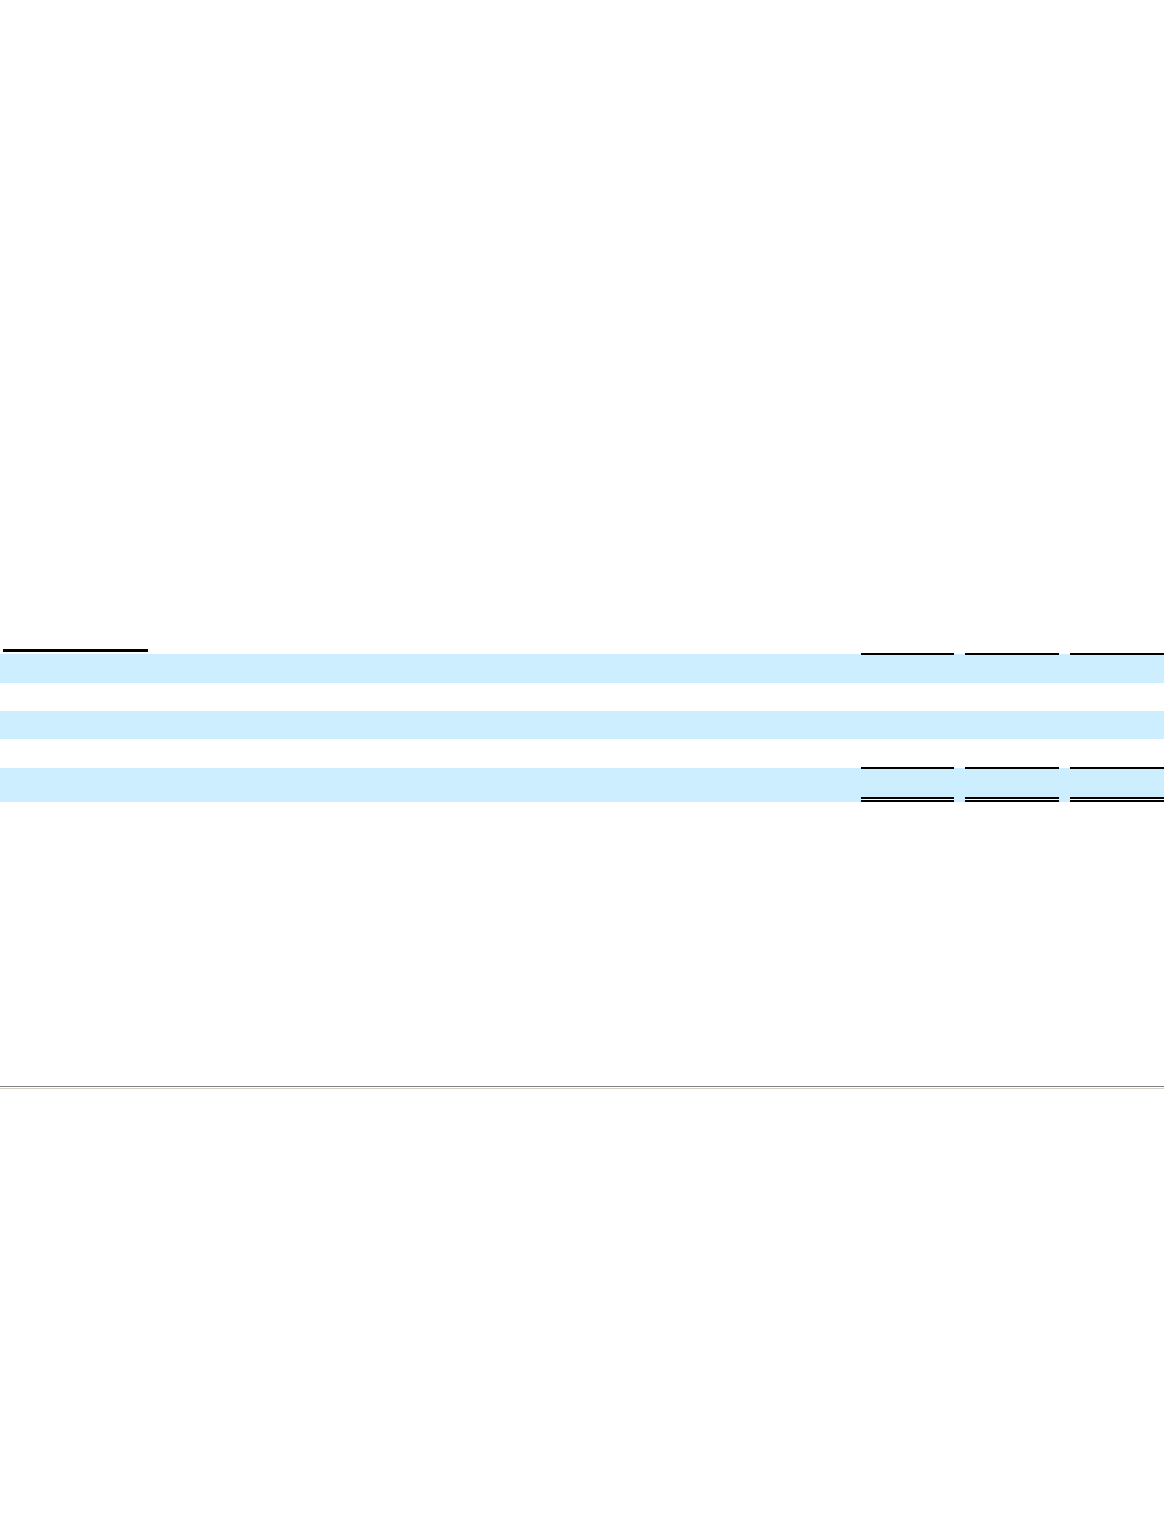
Table of Contents
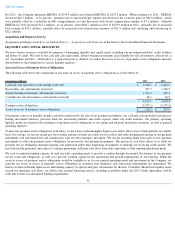
While we consider our overall investment portfolio to be part of our operations, in accordance with GAAP, investments in cash and cash
equivalents and trading investments are presented as part of operating activities, while investments in interest-bearing and available-for-
sale
investment securities are presented as part of investing activities. To understand the cash flow activity of our core business, the cash flows from
operating activities relating to the payment service assets and obligations should be reviewed in conjunction with the net cash flows from
investing activities related to our interest-bearing investments and available-for-
sale investments. The Company, in conjunction with its
November 2012 settlement of the MDPA/U.S. DOJ investigation, paid a forfeiture of $65.0 million in November 2012 and $35.0 million in
January 2013. These payments were made with the Company’
s cash on hand, and no borrowings or other external sources of liquidity were
required. This $100.0 million forfeiture did not have an adverse effect on the credit ratings of the Company and did not adversely affect
compliance with financial covenants pertaining to any of the Company’s credit agreements.
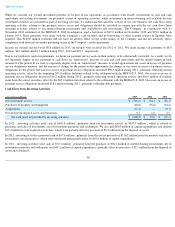
Income tax refunds received were $0.8 million in 2013; no refunds were received for 2012 or 2011. We made income tax payments of
$8.0
million , $2.9 million and $3.7 million during 2013 , 2012 and 2011 , respectively.
Due to our regulatory capital requirements, we deem our payment service assets in their entirety to be substantially restricted. As a result, we do
not separately display in our statement of cash flows an “unrestricted”
measure of cash and cash equivalents and the related change in such
measure for the period. If we were to separately display such an “unrestricted”
measure, it would approximate our assets in excess of payment
service obligations measure, and the amount of change for the period would approximate the change in our assets in excess of payment service
obligations for the period. Our assets in excess of payment service obligations increased $90.9 million during 2013
, primarily reflecting normal
operating activity, offset by the remaining $35.0 million forfeiture related to the settlement with the MDPA/U.S. DOJ. Our assets in excess of
payment service obligations increased $16.2 million during 2012
, primarily reflecting normal operating activity and $10.0 million of realized
gains from the sale of securities, offset by the $65.0 million forfeiture related to the settlement with the MDPA/U.S. DOJ. Our assets in excess of
payment service obligations decreased $18.6 million during 2011 , primarily reflecting debt payments.
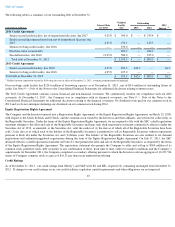
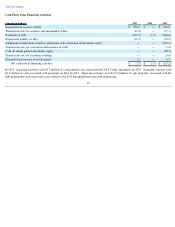
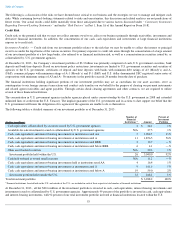
Cash Flows from Investing Activities
In 2013 , investing activities used cash of $608.8 million , primarily from net investment activity of $545.3 million
, which is related to
purchases and sales of investments, net of investment maturities and settlements. We also had $48.8 million
of capital expenditures and utilized
$15.4 million for our acquisition activities, which were partially offset by proceeds of $0.7 million from the disposal of assets.
In 2012 , investing activities generated cash of $57.6 million , primarily from the excess proceeds of $116.2 million
from the maturity and sale of
investments, net of purchases, which were reinvested and partially offset by $59.6 million of capital expenditures.
In 2011 , investing activities used cash of $70.3 million , primarily from the purchase of $28.7 million of interest-
bearing investments, net of
investment maturities and settlements and $44.2 million of capital expenditures, partially offset by proceeds of $2.7 million
from the disposal of
assets and a business.
46
(Amounts in millions) 2013
2012
2011
Net investment activity
$
(545.3
)
$
116.2
$
(28.7
)
Purchases of property and equipment
(48.8
)
(59.6
)
(44.2
)
Acquisitions
(15.4
)
—
(
0.1
)
Proceeds from disposal assets and businesses
0.7
1.0
2.7
Net cash (used in) provided by investing activities
$
(608.8
)
$
57.6
$
(70.3
)