MoneyGram 2013 Annual Report Download - page 116
Download and view the complete annual report
Please find page 116 of the 2013 MoneyGram annual report below. You can navigate through the pages in the report by either clicking on the pages listed below, or by using the keyword search tool below to find specific information within the annual report.-
 1
1 -
2
-
3
-
4
-
5
-
6
-
7
-
8
-
9
-
10
-
11
-
12
-
13
-
14
-
15
-
16
-
17
-
18
-
19
-
20
-
21
-
22
-
23
-
24
-
25
-
26
-
27
-
28
-
29
-
30
-
31
-
32
-
33
-
34
-
35
-
36
-
37
-
38
-
39
-
40
-
41
-
42
-
43
-
44
-
45
-
46
-
47
-
48
-
49
-
50
-
51
-
52
-
53
-
54
-
55
-
56
-
57
-
58
-
59
-
60
-
61
-
62
-
63
-
64
-
65
-
66
-
67
-
68
-
69
-
70
-
71
-
72
-
73
-
74
-
75
-
76
-
77
-
78
-
79
-
80
-
81
-
82
-
83
-
84
-
85
-
86
-
87
-
88
-
89
-
90
-
91
-
92
-
93
-
94
-
95
-
96
-
97
-
98
-
99
-
100
-
101
-
102
-
103
-
104
-
105
-
 106
106 -
 107
107 -
 108
108 -
 109
109 -
 110
110 -
 111
111 -
 112
112 -
 113
113 -
 114
114 -
 115
115 -
 116
116 -
 117
117 -
 118
118 -
 119
119 -
 120
120 -
 121
121 -
 122
122 -
 123
123 -
 124
124 -
 125
125 -
 126
126 -
127
-
128
-
129
-
130
-
131
-
132
-
133
-
134
-
135
-
136
-
137
-
138
 |
 |

Table of Contents
segment. However, investment revenue is allocated to each segment based on the average investable balances generated by that segment’
s sale
of payment instruments during the period. Net securities gains are not allocated to the segments as the investment portfolio is managed at a
consolidated level. While the derivatives portfolio is also managed on a consolidated level, each derivative instrument is utilized in a manner that
can be identified to a particular segment.
Also excluded from net operating income for Global Funds Transfer and Financial Paper Products are interest and other expenses related to the
Company’s credit agreements, items related to the Company’s preferred stock, operating income from businesses categorized as “Other,”
certain
pension and benefit obligation expenses, director deferred compensation plan expenses, executive severance and related costs, certain legal and
corporate costs not related to the performance of the segments.
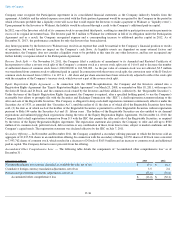
Unallocated expenses in 2013 include $2.5 million
of legal expenses for the settlement in connection with MDPA/U.S. DOJ investigation and
the shareholder litigation, $1.5 million of severance and related costs from executive terminations as well as other net corporate costs of
$11.6
million not allocated to the segments. Unallocated expenses in 2012 include $119.2 million
of legal expenses for the settlement in connection
with MDPA/U.S. DOJ investigation and the shareholder litigation, $1.0 million
of severance and related costs from executive terminations as
well as other net corporate costs of $7.6 million not allocated to the segments. Unallocated expenses in 2011 include $4.8 million
of legal
settlements and related costs for securities litigation associated with the Company's 2011 Recapitalization, $0.3 million
of asset impairments and
other net corporate costs of $4.8 million not allocated to the segments.
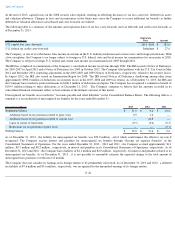
The following table is a summary of the total revenue by segment for the years ended December 31 :
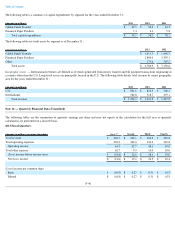
The following table is a summary of the operating income by segment and detail of income (loss) before income taxes for the years ended
December 31 :
The following table is a summary of depreciation and amortization expense by segment for the years ended December 31 :
F-45
(Amounts in millions) 2013
2012
2011
Global Funds Transfer revenue
Money transfer revenue
$
1,287.8
$
1,149.1
$
1,040.1
Bill payment revenue
102.0
106.1
112.6
Total Global Funds Transfer revenue
1,389.8
1,255.2
1,152.7
Financial Paper Products revenue
Money order revenue
55.1
57.5
60.4
Official check revenue
28.9
27.0
32.9
Total Financial Paper Products revenue
84.0
84.5
93.3
Other revenue
0.6
1.5
1.8
Total revenue
$
1,474.4
$
1,341.2
$
1,247.8
(Amounts in millions) 2013
2012
2011
Global Funds Transfer operating income
$
162.6
$
149.6
$
124.8
Financial Paper Products operating income
30.9
32.7
29.2
Total segment operating income
193.5
182.3
154.0
Other operating loss
(15.6
)
(129.9
)
(11.4
)
Total operating income
177.9
52.4
142.6
Net securities gains —
(
10.0
)
(32.8
)
Interest expense
47.3
70.9
86.2
Debt extinguishment costs
45.3
—
37.5
Other costs —
0.4
11.9
Income (loss) before income taxes
$
85.3
$
(8.9
)
$
39.8
(Amounts in millions) 2013
2012
2011
Global Funds Transfer
$
46.5
$
40.7
$
40.5
Financial Paper Products
3.9
3.5
5.4
Other
0.3
0.1
0.1
Total depreciation and amortization
$
50.7
$
44.3
$
46.0