MoneyGram 2013 Annual Report Download - page 37
Download and view the complete annual report
Please find page 37 of the 2013 MoneyGram annual report below. You can navigate through the pages in the report by either clicking on the pages listed below, or by using the keyword search tool below to find specific information within the annual report.-
 1
1 -
2
-
3
-
4
-
5
-
6
-
7
-
8
-
9
-
10
-
11
-
12
-
13
-
14
-
15
-
16
-
17
-
18
-
19
-
20
-
21
-
22
-
23
-
24
-
25
-
26
-
 27
27 -
 28
28 -
 29
29 -
 30
30 -
 31
31 -
 32
32 -
 33
33 -
 34
34 -
 35
35 -
 36
36 -
 37
37 -
 38
38 -
 39
39 -
 40
40 -
 41
41 -
 42
42 -
 43
43 -
 44
44 -
 45
45 -
 46
46 -
 47
47 -
48
-
49
-
50
-
51
-
52
-
53
-
54
-
55
-
56
-
57
-
58
-
59
-
60
-
61
-
62
-
63
-
64
-
65
-
66
-
67
-
68
-
69
-
70
-
71
-
72
-
73
-
74
-
75
-
76
-
77
-
78
-
79
-
80
-
81
-
82
-
83
-
84
-
85
-
86
-
87
-
88
-
89
-
90
-
91
-
92
-
93
-
94
-
95
-
96
-
97
-
98
-
99
-
100
-
101
-
102
-
103
-
104
-
105
-
106
-
107
-
108
-
109
-
110
-
111
-
112
-
113
-
114
-
115
-
116
-
117
-
118
-
119
-
120
-
121
-
122
-
123
-
124
-
125
-
126
-
127
-
128
-
129
-
130
-
131
-
132
-
133
-
134
-
135
-
136
-
137
-
138
 |
 |
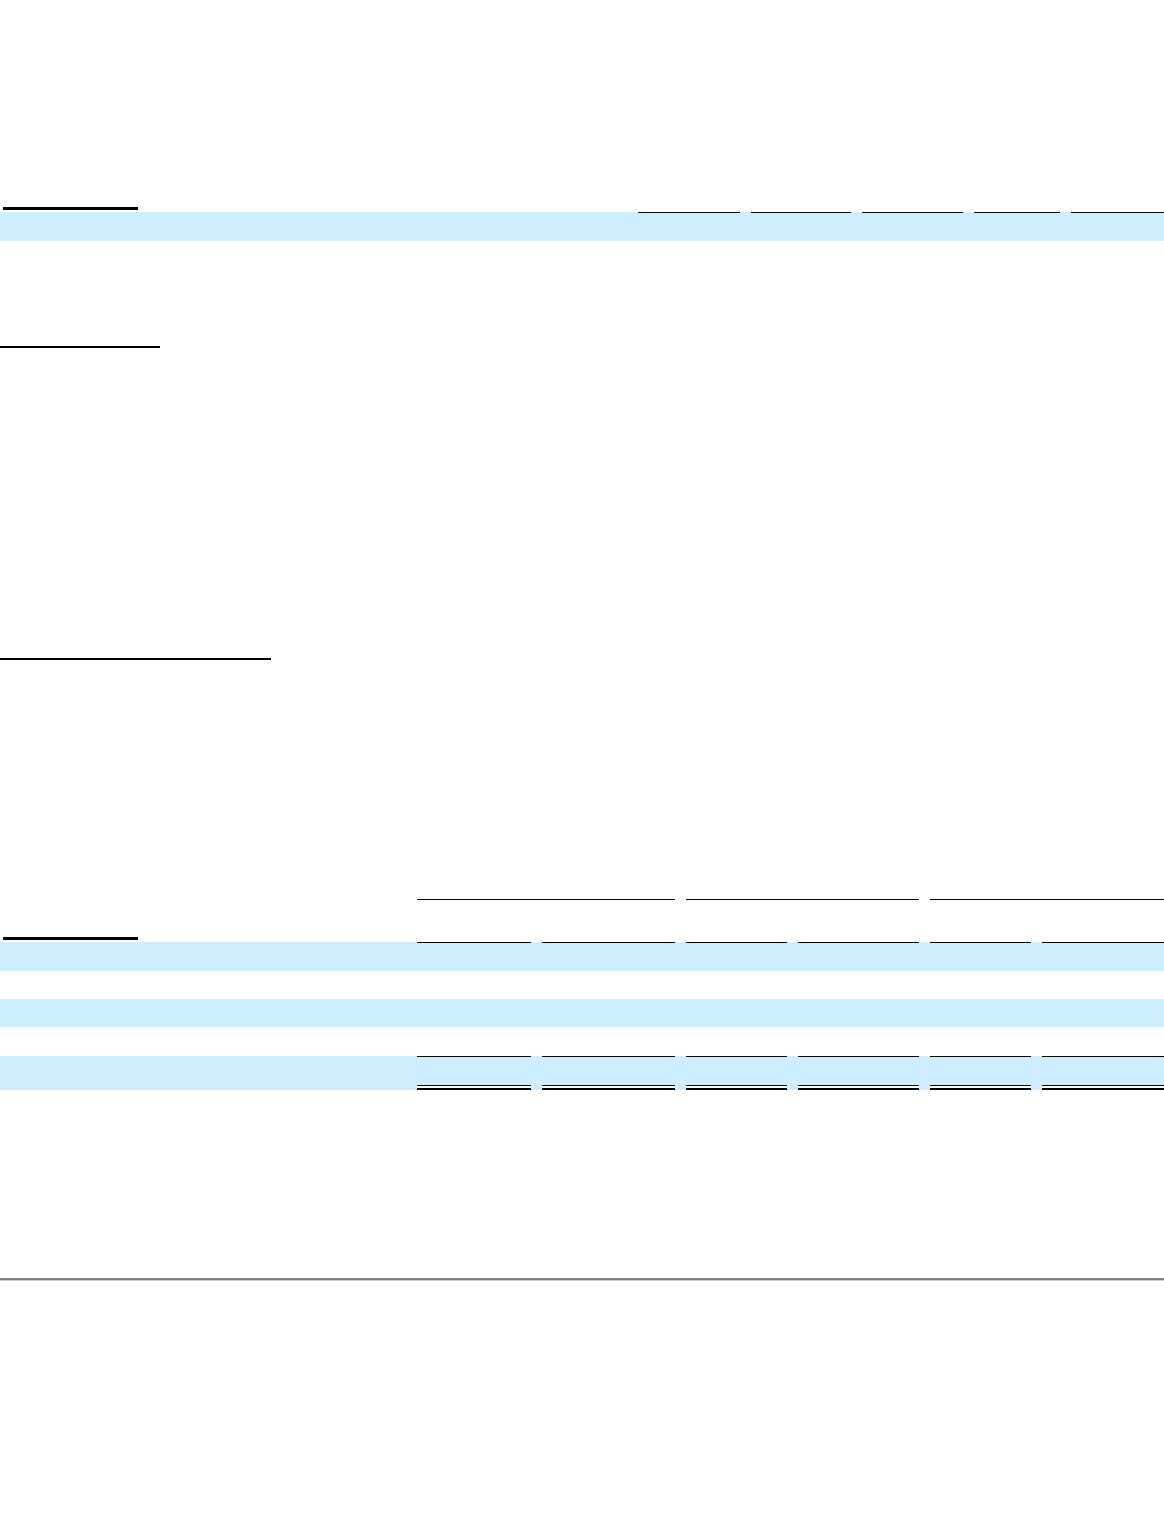
Table of Contents
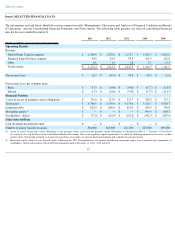
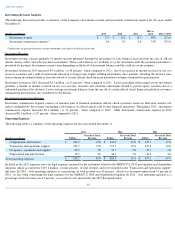
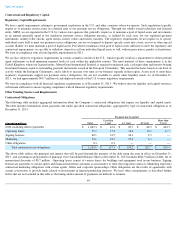
Investment Revenue Analysis
The following discussion provides a summary of the Company's investment revenue and investment commission expense for the years ended
December 31 :
(1)
Commissions are generated from the average outstanding cash balances of official checks sold.
Investment Revenue
Investment revenue consists primarily of interest income generated through the investment of cash balances received from the sale of official
checks, money orders and other payment instruments. These cash balances are available to us for investment until the payment instrument is
presented for payment. Investment revenue varies depending on the level of investment balances and the yield on our investments.
Investment revenue in 2013 increased $5.0 million , or 40 percent , when compared to 2012
, due to an increase in income received on our cost
recovery securities and a shift in investment allocation to longer term, higher yielding investments. Also partially offsetting the increase were
lower average investment balances from the run-off of certain official check financial institution customers terminated in prior periods.
Investment revenue in 2012 decreased $4.3 million , or 25 percent , when compared to 2011
. Lower prevailing yields earned on our investment
portfolio, a decline in income received on our cost recovery securities and valuation adjustments related to private equity securities drove a
substantial portion of the decrease. Lower average investment balances from the run-
off of certain official check financial institution customers
terminated in prior periods also contributed to the decline.
Investment Commissions Expense
Investment commissions expense consists of amounts paid to financial institution official check customers based on short-
term interest rate
indices multiplied by the average outstanding cash balances of official checks sold by that financial institution. Throughout 2013
, investment
commissions expense increased $0.1 million , or 33 percent , when compared to 2012 , while investment commissions expense in
2012
decreased $0.1 million , or 25 percent , when compared to 2011 .
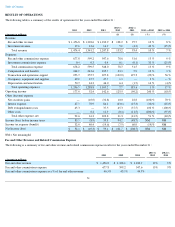
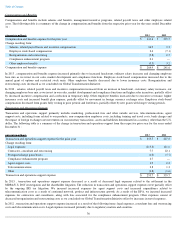
Operating Expenses
The following table is a summary of the operating expenses for the years ended December 31 :
Included in the 2012
expenses were the legal expenses incurred for the settlement related to the MDPA/U.S. DOJ investigation and shareholder
litigation, which accounted for $119.2 million , or nine percent
, of total revenue, and were recorded in the "Transaction and operations support"
line item. In 2013 , total operating expenses as a percentage of total revenue was 42 percent , which was an improvement from 51 percent
in
2012 , or flat, when considering the legal expenses for the MDPA/U.S. DOJ and shareholder litigation. In 2011
, total operating expenses as a
percentage of total revenue was 45 percent , as a result of costs incurred for the 2011 Recapitalization.
35
(Dollars in millions) 2013
2012
2011
2013 vs
2012
2012 vs 2011
Investment revenue
$
17.6
$
12.6
$
16.9
40
%
(25
)%
Investment commissions expense
(1)
0.4
0.3
0.4
33
%
(25
)%
2013
2012
2011
(Dollars in millions) Dollars
Percent of Total
Revenue
Dollars
Percent of Total
Revenue
Dollars
Percent of Total
Revenue
Compensation and benefits
$
264.9
18
%
$
241.6
18
%
$
235.7
19
%
Transaction and operations support
253.7
17
%
355.7
27
%
227.8
18
%
Occupancy, equipment and supplies
49.0
3
%
47.7
3
%
47.7
4
%
Depreciation and amortization
50.7
4
%
44.3
3
%
46.0
4
%
Total operating expenses
$
618.3
42
%
$
689.3
51
%
$
557.2
45
%