MoneyGram 2013 Annual Report Download - page 30
Download and view the complete annual report
Please find page 30 of the 2013 MoneyGram annual report below. You can navigate through the pages in the report by either clicking on the pages listed below, or by using the keyword search tool below to find specific information within the annual report.-
 1
1 -
2
-
3
-
4
-
5
-
6
-
7
-
8
-
9
-
10
-
11
-
12
-
13
-
14
-
15
-
16
-
17
-
18
-
19
-
 20
20 -
 21
21 -
 22
22 -
 23
23 -
 24
24 -
 25
25 -
 26
26 -
 27
27 -
 28
28 -
 29
29 -
 30
30 -
 31
31 -
 32
32 -
 33
33 -
 34
34 -
 35
35 -
 36
36 -
 37
37 -
 38
38 -
 39
39 -
 40
40 -
41
-
42
-
43
-
44
-
45
-
46
-
47
-
48
-
49
-
50
-
51
-
52
-
53
-
54
-
55
-
56
-
57
-
58
-
59
-
60
-
61
-
62
-
63
-
64
-
65
-
66
-
67
-
68
-
69
-
70
-
71
-
72
-
73
-
74
-
75
-
76
-
77
-
78
-
79
-
80
-
81
-
82
-
83
-
84
-
85
-
86
-
87
-
88
-
89
-
90
-
91
-
92
-
93
-
94
-
95
-
96
-
97
-
98
-
99
-
100
-
101
-
102
-
103
-
104
-
105
-
106
-
107
-
108
-
109
-
110
-
111
-
112
-
113
-
114
-
115
-
116
-
117
-
118
-
119
-
120
-
121
-
122
-
123
-
124
-
125
-
126
-
127
-
128
-
129
-
130
-
131
-
132
-
133
-
134
-
135
-
136
-
137
-
138
 |
 |

Table of Contents
Item 7. MANAGEMENT’S DISCUSSION AND ANALYSIS OF FINANCIAL CONDITION AND RESULTS OF OPERATIONS
The following discussion should be read in conjunction with our Consolidated Financial Statements and related Notes. This discussion contains
forward-
looking statements that involve risks and uncertainties. Our actual results could differ materially from those anticipated due to various
factors discussed below under “ Cautionary Statements Regarding Forward-Looking Statements ” and under the caption “ Risk Factors ”
in
Part 1, Item 1A of this Annual Report on Form 10-K.
The comparisons presented in this MD&A refer to the same period in the prior year, unless otherwise noted. This MD&A is organized in the
following sections:
OVERVIEW
MoneyGram is a leading global money transfer and payment services company operating in approximately 336,000
agent locations in more than
200
countries and territories. Our major products include global money transfers, bill payment services, money order services and official check
processing. As an alternative financial services provider, our primary consumers are unbanked or underbanked consumers. We primarily offer
services through third-
party agents, including retail chains, independent retailers, post offices and other financial institutions. We continue to be
an innovator in the industry by diversifying our core money transfer revenue through new channels, such as online, mobile, kiosks and other
self-service channels.
Our global money transfer and bill payment services are our primary revenue drivers, accounting for 95 percent
of total fee and other revenue for
the year ended December 31, 2013
. The market for money transfer and bill payment services remains very competitive, consisting of a small
number of large competitors and a large number of small, niche competitors. While we are the second largest money transfer company in the
world (based on total face value of remittances in 2012), we will encounter increasing competition as new technologies emerge that allow
consumers to send and receive money in a variety of ways.
We manage our revenue and related commission expenses through two reporting segments: Global Funds Transfer and Financial Paper Products.
Businesses that are not operated within these segments are categorized as “Other,”
and are primarily related to discontinued products and
businesses, and also contain corporate items. Our sales efforts are organized based on the nature of products and the services offered. Operating
expenses are discussed based on the functional nature of the expense.
See summary of key 2013 events as disclosed in Part 1, Item 1, " 2013 Events " of this Annual Report on Form 10-K.
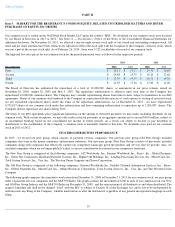
Business Environment
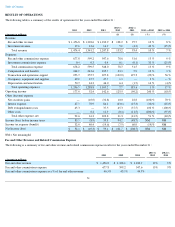
Overall, our total revenue growth for the year ended December 31, 2013 was 10 percent
, which was driven by the success of the money transfer
product. Our money transfer fee and other revenue growth for the year ended December 31, 2013 was 12 percent
, as our money transfer
transaction growth for the year ended December 31, 2013 was 13 percent .
Throughout 2013
, worldwide economic conditions continued to remain weak, as evidenced by high unemployment rates, government assistance
to citizens and businesses on a global basis, restricted lending activity and low consumer confidence, among other factors. Historically, the
remittance industry has generally been resilient during times of economic softness as money transfers are deemed essential to many, with the
funds used by the receiving party for food, housing and other basic needs. Given the global reach and extent of the current economic recession,
the growth of money transfer volumes and the average principal of money transfers continued to fluctuate by corridor and country in 2013
,
particularly in Europe. Also, there is continued political unrest in parts of the Middle East and Africa that contributed to volatile fluctuations in
selected countries such as Egypt and Libya.
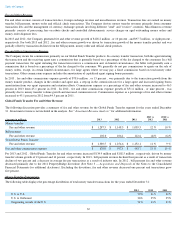
In 2013 , the U.S. to Outbound corridors generated 18 percent
transaction growth, which was primarily driven by sends to Mexico, which had
transaction growth of 31 percent. Transaction growth originating outside of the U.S. grew 13 percent
on a year over year basis, which was
primarily driven by the Western European, Latin American and Caribbean regions. The U.S. to U.S. corridor grew seven percent
and accounted
for 30 percent
of total money transfer transactions. At the end of 2012, our largest competitor announced significant price cuts in several
markets. To date, we have limited our pricing actions primarily to certain online corridors and matched lower prices at our U.S. Walmart agent
locations.
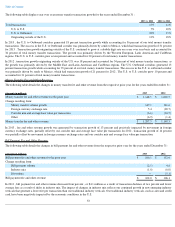
As of December 31, 2013 , our money transfer agent base expanded eight percent to approximately 336,000 locations, compared to over
310,000
locations as of December 31, 2012 , primarily due to expansion in the U.S., Russia and India. We continue to
28
•
Overview
•
Results of Operations
•
Liquidity and Capital Resources
•
Critical Accounting Policies and Estimates
• Cautionary Statements Regarding Forward-
Looking Statements