MoneyGram 2013 Annual Report Download - page 43
Download and view the complete annual report
Please find page 43 of the 2013 MoneyGram annual report below. You can navigate through the pages in the report by either clicking on the pages listed below, or by using the keyword search tool below to find specific information within the annual report.-
 1
1 -
2
-
3
-
4
-
5
-
6
-
7
-
8
-
9
-
10
-
11
-
12
-
13
-
14
-
15
-
16
-
17
-
18
-
19
-
20
-
21
-
22
-
23
-
24
-
25
-
26
-
27
-
28
-
29
-
30
-
31
-
32
-
 33
33 -
 34
34 -
 35
35 -
 36
36 -
 37
37 -
 38
38 -
 39
39 -
 40
40 -
 41
41 -
 42
42 -
 43
43 -
 44
44 -
 45
45 -
 46
46 -
 47
47 -
 48
48 -
 49
49 -
 50
50 -
 51
51 -
 52
52 -
 53
53 -
54
-
55
-
56
-
57
-
58
-
59
-
60
-
61
-
62
-
63
-
64
-
65
-
66
-
67
-
68
-
69
-
70
-
71
-
72
-
73
-
74
-
75
-
76
-
77
-
78
-
79
-
80
-
81
-
82
-
83
-
84
-
85
-
86
-
87
-
88
-
89
-
90
-
91
-
92
-
93
-
94
-
95
-
96
-
97
-
98
-
99
-
100
-
101
-
102
-
103
-
104
-
105
-
106
-
107
-
108
-
109
-
110
-
111
-
112
-
113
-
114
-
115
-
116
-
117
-
118
-
119
-
120
-
121
-
122
-
123
-
124
-
125
-
126
-
127
-
128
-
129
-
130
-
131
-
132
-
133
-
134
-
135
-
136
-
137
-
138
 |
 |

Table of Contents
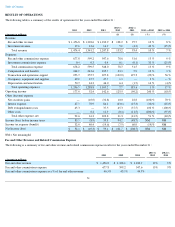
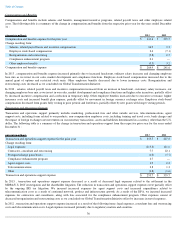
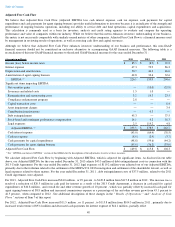
For 2012 , the Company generated EBITDA of $139.9 million and Adjusted EBITDA of $278.9 million . When compared to 2011
, EBITDA
decreased $64.7 million , or 32 percent , primarily due to increased legal expense and decreased net securities gains of $22.8 million
, which
were partially offset by a reduction in debt extinguishment cost and decreased stock-based compensation expense of $7.1 million
. Adjusted
EBITDA for 2012 increased $15.2 million , or six percent , from $263.7 million in 2011 to $278.9 million in 2012
, primarily due to increased
total revenue of $93.4 million , partially offset by increased total commissions expenses of $51.5 million
and consulting and outsourcing of
$22.1 million.
Acquisition and Disposal Activity
Acquisition and disposal activity is set forth in Note 3 — Acquisitions and Disposals of the Notes to the Consolidated Financial Statements.
LIQUIDITY AND CAPITAL RESOURCES
We have various resources available for purposes of managing liquidity and capital needs, including our investment portfolio, credit facilities
and letters of credit. We refer to our cash and cash equivalents, interest-bearing investments and available-for-
sale investments collectively as
our “investment portfolio.”
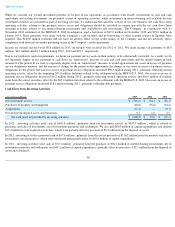
Although it is a capital measure as defined, we utilize the assets in excess of payment service obligations measure
shown below as the foundation for various liquidity analyses.
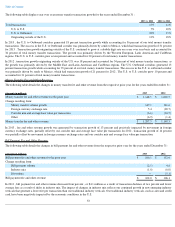
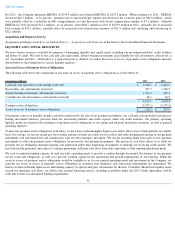
Assets in Excess of Payment Service Obligations
The following table shows the components of our assets in excess of payment service obligations as of December 31 :
Our primary sources of liquidity include cash flows generated by the sale of our payment instruments, our cash and cash equivalent and interest-
bearing investment balances, proceeds from our investment portfolio and credit capacity under our credit facilities. Our primary operating
liquidity needs are related to the settlement of payment service obligations to our agents and financial institution customers, as well as general
operating expenses.
To meet our payment service obligations at all times, we must have sufficient highly liquid assets and be able to move funds globally on a timely
basis. On average, we receive in and pay out a similar amount of funds on a daily basis to collect and settle the principal amount of our payment
instruments sold and related fees and commissions with our end consumers and agents. We use the incoming funds from sales of new payment
instruments to settle our payment service obligations for previously sold payment instruments. This pattern of cash flows allows us to settle our
payment service obligations through ongoing cash generation rather than liquidating investments or utilizing our revolving credit facility. We
have historically generated, and expect to continue generating, sufficient cash flows from daily operations to fund ongoing operational needs.
We seek to maintain funding capacity beyond our daily operating needs to provide a cushion through the normal fluctuations in our payment
service assets and obligations, as well as to provide working capital for the operational and growth requirements of our business. While the
assets in excess of payment service obligations would be available to us for our general operating needs and investment in the Company, we
consider our assets in excess of payment service obligations as assurance that regulatory and contractual requirements are maintained. We
believe we have sufficient liquid assets and funding capacity to operate and grow our business for the next 12 months. Should our liquidity needs
exceed our operating cash flows, we believe that external financing sources, including availability under the 2013 Credit Agreement, will be
sufficient to meet our anticipated funding requirements.
41
(Amounts in millions) 2013
2012
Cash and cash equivalents (substantially restricted)
$
2,228.5
$
2,683.2
Receivables, net (substantially restricted)
767.7
1,206.5
Interest-bearing investments (substantially restricted)
1,011.6
450.1
Available-for-sale investments (substantially restricted)
48.1
63.5
4,055.9
4,403.3
Payment service obligations
(3,737.1
)
(4,175.4
)
Assets in excess of payment service obligations
$
318.8
$
227.9