MoneyGram 2013 Annual Report Download - page 44
Download and view the complete annual report
Please find page 44 of the 2013 MoneyGram annual report below. You can navigate through the pages in the report by either clicking on the pages listed below, or by using the keyword search tool below to find specific information within the annual report.-
 1
1 -
2
-
3
-
4
-
5
-
6
-
7
-
8
-
9
-
10
-
11
-
12
-
13
-
14
-
15
-
16
-
17
-
18
-
19
-
20
-
21
-
22
-
23
-
24
-
25
-
26
-
27
-
28
-
29
-
30
-
31
-
32
-
33
-
 34
34 -
 35
35 -
 36
36 -
 37
37 -
 38
38 -
 39
39 -
 40
40 -
 41
41 -
 42
42 -
 43
43 -
 44
44 -
 45
45 -
 46
46 -
 47
47 -
 48
48 -
 49
49 -
 50
50 -
 51
51 -
 52
52 -
 53
53 -
 54
54 -
55
-
56
-
57
-
58
-
59
-
60
-
61
-
62
-
63
-
64
-
65
-
66
-
67
-
68
-
69
-
70
-
71
-
72
-
73
-
74
-
75
-
76
-
77
-
78
-
79
-
80
-
81
-
82
-
83
-
84
-
85
-
86
-
87
-
88
-
89
-
90
-
91
-
92
-
93
-
94
-
95
-
96
-
97
-
98
-
99
-
100
-
101
-
102
-
103
-
104
-
105
-
106
-
107
-
108
-
109
-
110
-
111
-
112
-
113
-
114
-
115
-
116
-
117
-
118
-
119
-
120
-
121
-
122
-
123
-
124
-
125
-
126
-
127
-
128
-
129
-
130
-
131
-
132
-
133
-
134
-
135
-
136
-
137
-
138
 |
 |
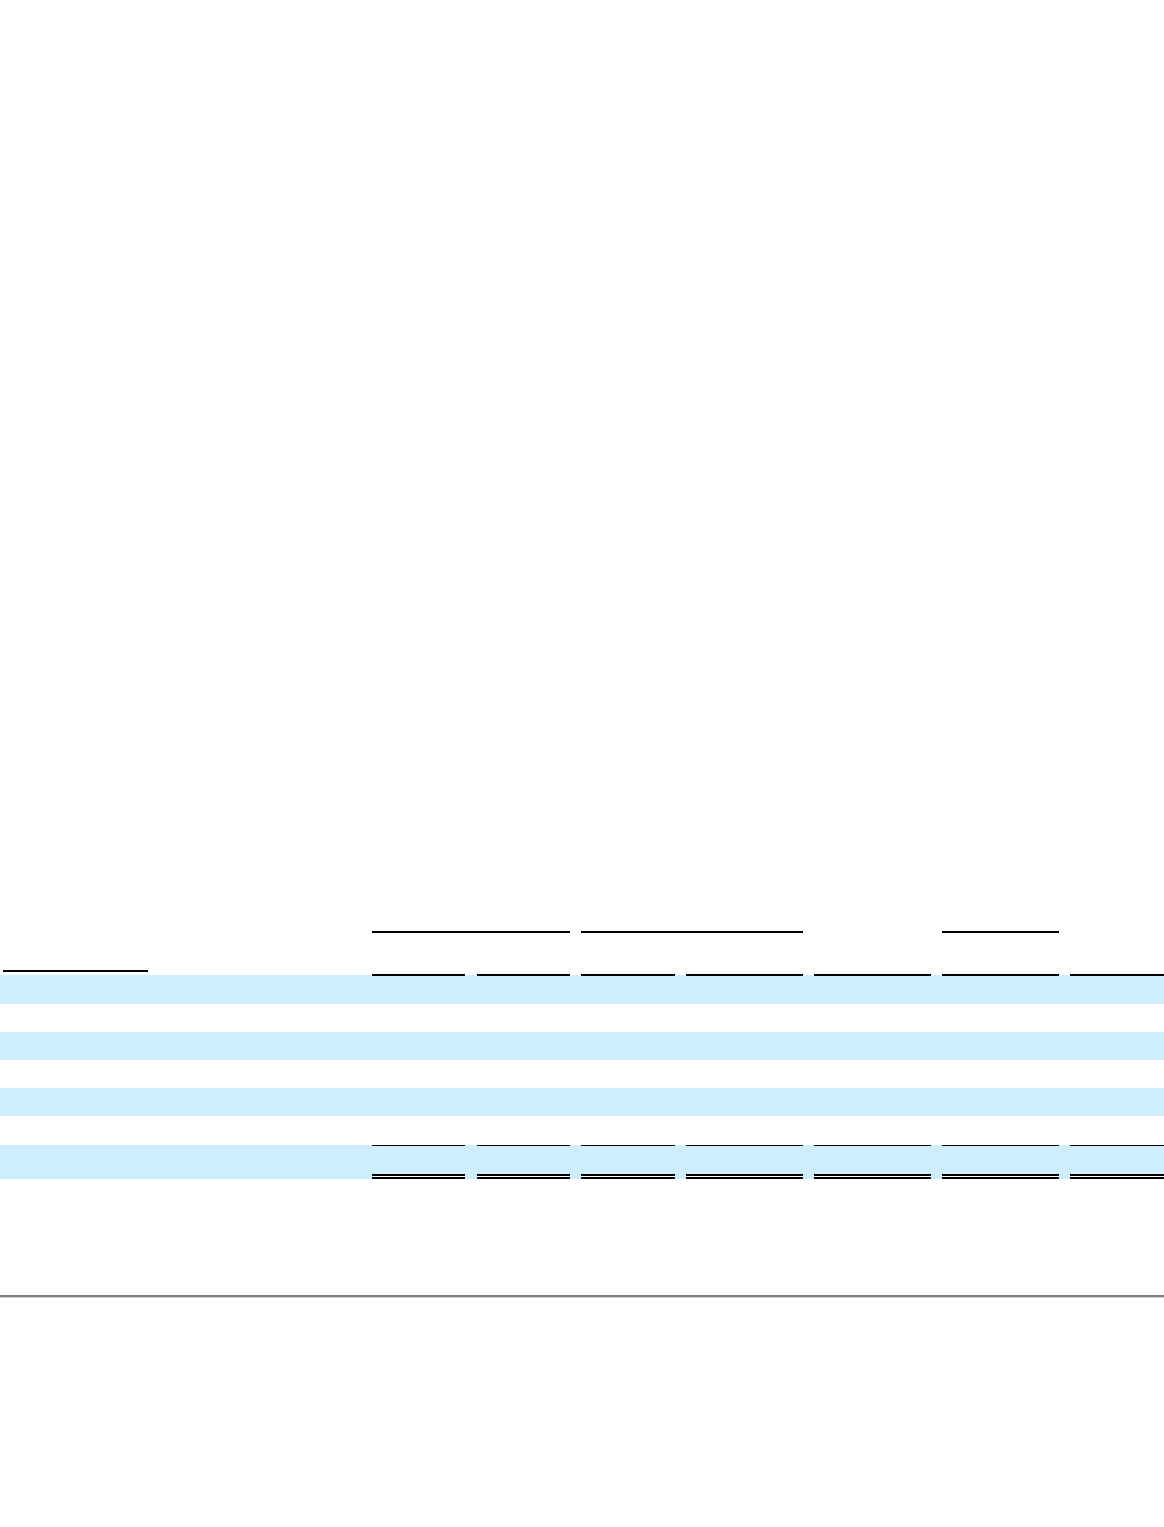
Table of Contents
Cash and Cash Equivalents (substantially restricted) and Interest-bearing Investments (substantially restricted)
To ensure we maintain adequate liquidity to meet our operating needs at all times, we keep a significant portion of our investment portfolio in
cash and cash equivalents and interest-bearing investments at financial institutions rated A3 or better by Moody’s Investor Service, or Moody’
s,
and A- or better by Standard & Poors, or S&P, and in U.S. government money market funds rated Aaa by Moody’
s and AAA by S&P. If the
rating agencies have split ratings, the Company uses the highest two out of three ratings across the rating agencies for disclosure purposes. If
none of the rating agencies have the same rating, the Company uses the lowest rating across the agencies for disclosure purposes. As of
December 31, 2013 , cash and cash equivalents and interest-bearing investments totaled $3.2 billion , representing 99 percent
of our total
investment portfolio. Cash equivalents and interest-
bearing investments consist of money market funds that invest in U.S. government and
government agency securities, time deposits and certificates of deposit.
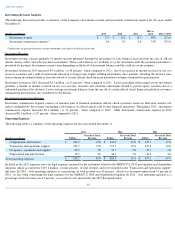
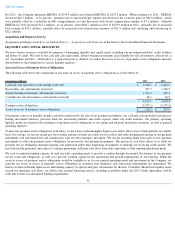
Available-for-sale Investments (substantially restricted)
Our investment portfolio includes $48.1 million of available-for-sale investments as of December 31, 2013
. U.S. government agency residential
mortgage-backed securities and U.S. government agency debentures compose $27.5 million of our available-for-
sale investments, while other
asset-backed securities compose the remaining $20.6 million .
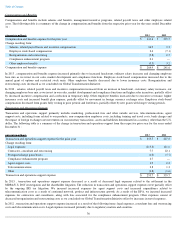
Clearing and Cash Management Banks
We collect and disburse money through a network of clearing and cash management banks. The relationships with these banks are a critical
component of our ability to maintain our global active funding requirements on a timely basis. We have agreements with five
active clearing
banks that provide clearing and processing functions for official checks, money orders and other draft instruments. We have four
active official
check clearing banks, which provide sufficient capacity for our official check business. We rely on three
active banks to clear our retail money
orders and believe that these banks provide sufficient capacity for that business. We also maintain relationships with a variety of domestic and
international cash management banks for EFT and wire transfer services used in the movement of consumer funds and agent settlements.
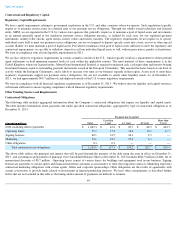
Special Purpose Entities
For certain financial institution customers, we established individual special purpose entities, or SPEs, upon the origination of our relationship.
Along with operational processes and certain financial covenants, these SPEs provide the financial institutions with additional assurance of our
ability to clear their official checks. For the years ending December 31, 2013 and 2012 , the Company’
s SPEs had cash and cash equivalents of
$8.7 million and $29.9 million , respectively, and payment service obligations of $7.2 million and $24.0 million , respectively. See Note 1
—
Description of the Business and Basis of Presentation of the Notes to the Consolidated Financial Statements for additional disclosure.
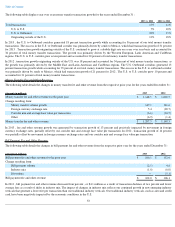
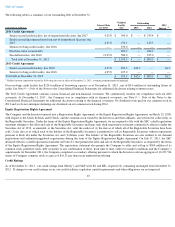
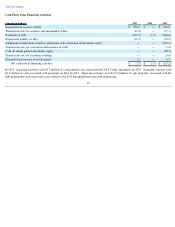
Credit Facilities
Our credit facility consists of the 2013 Credit Agreement, see Note 9 — Debt
of the Notes to the Consolidated Financial Statements for
additional disclosure. The following table is a summary of principal payments and debt issuance from January 1, 2011 to December 31, 2013 :
We have paid down $228.3 million of our outstanding debt since January 2011, excluding payments related to debt refinance of $959.4 million
.
We continue to evaluate further reductions of our outstanding debt ahead of scheduled maturities.
42
2008 Senior Facility
2011 Credit Agreement
2013 Credit
Agreement
(Amounts in millions) Tranche A
Tranche B
Term loan
Incremental
term loan
Second Lien
Notes
Term credit
facility
Total Debt
Balance at January 1, 2011
$
100.0
$
41.2
$
—
$
—
$
500.0
$
—
$
641.2
2011 new debt issued —
—
390.0
150.0
—
—
540.0
2011 payments
(100.0
)
(41.2
)
(50.0
)
(0.4
)
(175.0
)
—
(
366.6
)
2012 payments —
—
—
(
1.5
)
—
—
(
1.5
)
2013 new debt issued —
—
—
—
—
850.0
850.0
2013 payments —
—
(
340.0
)
(148.1
)
(325.0
)
(6.4
)
(819.5
)
Balance at December 31, 2013
$
—
$
—
$
—
$
—
$
—
$
843.6
$
843.6