MoneyGram 2013 Annual Report Download - page 112
Download and view the complete annual report
Please find page 112 of the 2013 MoneyGram annual report below. You can navigate through the pages in the report by either clicking on the pages listed below, or by using the keyword search tool below to find specific information within the annual report.-
 1
1 -
2
-
3
-
4
-
5
-
6
-
7
-
8
-
9
-
10
-
11
-
12
-
13
-
14
-
15
-
16
-
17
-
18
-
19
-
20
-
21
-
22
-
23
-
24
-
25
-
26
-
27
-
28
-
29
-
30
-
31
-
32
-
33
-
34
-
35
-
36
-
37
-
38
-
39
-
40
-
41
-
42
-
43
-
44
-
45
-
46
-
47
-
48
-
49
-
50
-
51
-
52
-
53
-
54
-
55
-
56
-
57
-
58
-
59
-
60
-
61
-
62
-
63
-
64
-
65
-
66
-
67
-
68
-
69
-
70
-
71
-
72
-
73
-
74
-
75
-
76
-
77
-
78
-
79
-
80
-
81
-
82
-
83
-
84
-
85
-
86
-
87
-
88
-
89
-
90
-
91
-
92
-
93
-
94
-
95
-
96
-
97
-
98
-
99
-
100
-
101
-
 102
102 -
 103
103 -
 104
104 -
 105
105 -
 106
106 -
 107
107 -
 108
108 -
 109
109 -
 110
110 -
 111
111 -
 112
112 -
 113
113 -
 114
114 -
 115
115 -
 116
116 -
 117
117 -
 118
118 -
 119
119 -
 120
120 -
 121
121 -
 122
122 -
123
-
124
-
125
-
126
-
127
-
128
-
129
-
130
-
131
-
132
-
133
-
134
-
135
-
136
-
137
-
138
 |
 |

Table of Contents
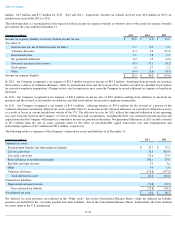
million , $2.9 million and $3.7 million for 2013 , 2012 and 2011 , respectively. Income tax refunds received were $0.8 million
in 2013; no
refunds were received for 2012 or 2011.
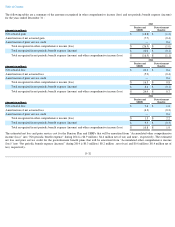
The following table is a reconciliation of the expected federal income tax expense (benefit) at statutory rates to the actual tax expense (benefit)
provided for the years ended in December 31 :
In 2013 , the Company recognized a tax expense of $32.9 million on pre-tax income of $85.3 million
, benefiting from proceeds on securities
that result in a release of valuation allowance, offset by international taxes and the reversal of tax benefits recorded on cancelled stock options
for executive employee terminations. Changes in facts and circumstances may cause the Company to record additional tax expense or benefits in
the future.
In 2012 , the Company recognized a tax expense of $40.4 million on pre-tax loss of $8.9 million
resulting from additions to uncertain tax
positions and the reversal of tax benefits recorded on cancelled stock options for executive employee terminations.
In 2011 , the Company recognized a tax benefit of $19.6 million , reflecting benefits of $34.0 million
for the reversal of a portion of the
valuation allowance on domestic deferred tax assets, partially offset by an increase in the valuation allowance on a portion of deferred tax assets
as a result of losses in certain jurisdictions outside of the U.S. The effective tax rate for 2011 reflects the expected utilization of net operating
loss carry-forwards based on the Company’
s review of current facts and circumstances, including the three year cumulative income position and
expectations that the Company will maintain a cumulative income tax position in the future. Net permanent differences in 2011 include a benefit
of $9.7 million from the sale of assets, partially offset by the effect of non-
deductible capital transaction costs and reorganization and
restructuring expenses of $2.1 million and $0.9 million , respectively.
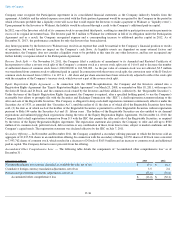
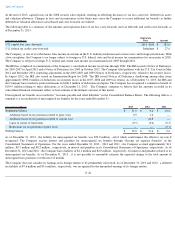
The following table is a summary of the Company’s deferred tax assets and liabilities as of December 31 :
Net deferred tax asset positions are reflected in the
“Other assets”
line in the Consolidated Balance Sheets, while net deferred tax liability
positions are included in the “Accounts payable and other liabilities” line in the Consolidated Balance Sheets. Substantially
all of the deferred
tax assets relate to the U.S. jurisdiction.
F-41
(Amounts in millions) 2013
2012
2011
Income tax expense (benefit) at statutory federal income tax rate
$
29.8
$
(3.1
)
$
13.9
Tax effect of:
State income tax, net of federal income tax effect
1.7
0.9
1.9
Valuation allowance
(2.7
)
0.6
(31.4
)
International taxes
3.2
1.8
1.3
Net permanent difference
0.2
1.0
(6.0
)
(Decrease) increase in tax reserve
(0.5
)
37.1
(0.2
)
Stock options
1.6
3.7
1.3
Other
(0.4
)
(1.6
)
(0.4
)
Income tax expense (benefit)
$
32.9
$
40.4
$
(19.6
)
(Amounts in millions) 2013
2012
Deferred tax assets:
Postretirement benefits and other employee benefits
$
39.7
$
57.3
Tax loss carryovers
76.3
415.0
Tax credit carryovers
27.6
27.9
Basis difference in revalued investments
106.1
87.9
Bad debt and other reserves
3.5
3.6
Other
5.0
1.9
Valuation allowance
(174.8
)
(477.0
)
Total deferred tax asset
83.4
116.6
Deferred tax liabilities:
Depreciation and amortization
(72.8
)
(70.3
)
Gross deferred tax liability
(72.8
)
(70.3
)
Net deferred tax asset
$
10.6
$
46.3