MetLife 2004 Annual Report Download - page 95
Download and view the complete annual report
Please find page 95 of the 2004 MetLife annual report below. You can navigate through the pages in the report by either clicking on the pages listed below, or by using the keyword search tool below to find specific information within the annual report.-
 1
1 -
2
-
3
-
4
-
5
-
6
-
7
-
8
-
9
-
10
-
11
-
12
-
13
-
14
-
15
-
16
-
17
-
18
-
19
-
20
-
21
-
22
-
23
-
24
-
25
-
26
-
27
-
28
-
29
-
30
-
31
-
32
-
33
-
34
-
35
-
36
-
37
-
38
-
39
-
40
-
41
-
42
-
43
-
44
-
45
-
46
-
47
-
48
-
49
-
50
-
51
-
52
-
53
-
54
-
55
-
56
-
57
-
58
-
59
-
60
-
61
-
62
-
63
-
64
-
65
-
66
-
67
-
68
-
69
-
70
-
71
-
72
-
73
-
74
-
75
-
76
-
77
-
78
-
79
-
80
-
81
-
82
-
83
-
84
-
 85
85 -
 86
86 -
 87
87 -
 88
88 -
 89
89 -
 90
90 -
 91
91 -
 92
92 -
 93
93 -
 94
94 -
 95
95 -
 96
96 -
 97
97 -
 98
98 -
 99
99 -
 100
100 -
 101
101
 |
 |

METLIFE, INC.
NOTES TO CONSOLIDATED FINANCIAL STATEMENTS — (Continued)
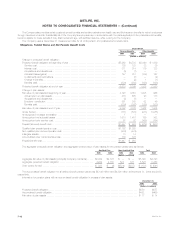
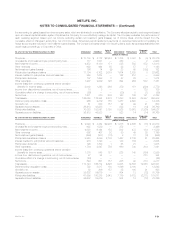
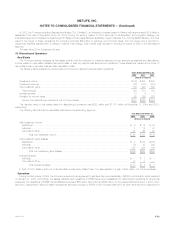
Auto & Corporate
For the Year Ended December 31, 2002 Institutional Individual Home International Reinsurance & Other Total
(Dollars in millions)
Premiums*********************************************** $ 8,245 $ 4,507 $2,828 $ 1,511 $ 2,005 $ (19) $ 19,077
Universal life and investment-type product policy fees ********** 624 1,379 — 144 — — 2,147
Net investment income************************************ 3,909 6,237 177 461 421 (22) 11,183
Other revenues ****************************************** 609 418 26 14 43 56 1,166
Net investment gains (losses) ****************************** (488) (290) (46) (9) (3) (56) (892)
Policyholder benefits and claims **************************** 9,345 5,064 2,019 1,388 1,554 3 19,373
Interest credited to policyholder account balances ************* 932 1,793 — 79 146 — 2,950
Policyholder dividends ************************************ 115 1,770 — 35 22 — 1,942
Other expenses****************************************** 1,531 2,639 793 507 617 726 6,813
Income (loss) from continuing operations before provision
(benefit) for income taxes ******************************** 976 985 173 112 127 (770) 1,603
Income from discontinued operations, net of income taxes****** 127 204 — — — 161 492
Net income (loss) **************************************** 759 826 132 84 84 (280) 1,605
Net investment income and net investment gains (losses) are based upon the actual results of each segment’s specifically identifiable asset portfolio
adjusted for allocated capital. Other costs are allocated to each of the segments based upon: (i) a review of the nature of such costs; (ii) time studies
analyzing the amount of employee compensation costs incurred by each segment; and (iii) cost estimates included in the Company’s product pricing.
Beginning in 2003, the Company changed its methodology of allocating capital to its business segments from Risk-Based Capital (‘‘RBC’’) to
Economic Capital. Prior to 2003, the Company’s business segments’ allocated equity was primarily based on RBC, an internally developed formula
based on applying a multiple to the NAIC Statutory Risk-Based Capital and included certain adjustments in accordance with GAAP. Economic Capital is
an internally developed risk capital model, the purpose of which is to measure the risk in the business and to provide a basis upon which capital is
deployed. The Economic Capital model accounts for the unique and specific nature of the risks inherent in MetLife’s businesses. This is in contrast to the
standardized regulatory RBC formula, which is not as refined in its risk calculations with respect to the nuances of the Company’s businesses.
The change in methodology is being applied prospectively. This change has and will continue to impact the level of net investment income and net
income of each of the Company’s business segments. A portion of net investment income is credited to the segments based on the level of allocated
equity. This change in methodology of allocating equity does not impact the Company’s consolidated net investment income or net income.
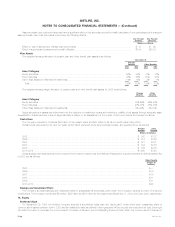
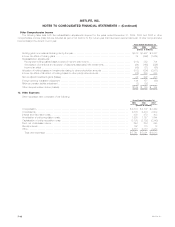
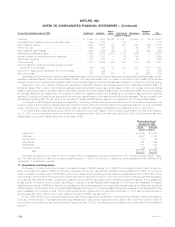
The following table presents actual and pro forma net investment income with respect to the Company’s segments for the year ended Decem-
ber 31, 2002. The amounts shown as pro forma reflect net investment income that would have been reported in 2002 had the Company allocated
capital based on Economic Capital rather than on the basis of RBC.
Net Investment Income
For the Year Ended
December 31, 2002
Actual Pro forma
(Dollars in millions)
Institutional **************************************************************************************** $ 3,909 $ 3,971
Individual****************************************************************************************** 6,237 6,148
Auto & Home************************************************************************************** 177 160
International *************************************************************************************** 461 424
Reinsurance*************************************************************************************** 421 382
Corporate & Other********************************************************************************** (22) 98
Total ************************************************************************************* $11,183 $11,183
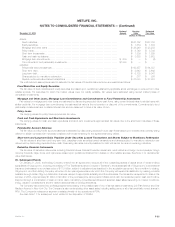
Revenues derived from any customer did not exceed 10% of consolidated revenues. Revenues from U.S. operations were $35,058 million,
$31,844 million and $29,878 million for the years ended December 31, 2004, 2003 and 2002, respectively, which represented 90%, 90% and 91%,
respectively, of consolidated revenues.
17. Acquisitions and Dispositions
On January 31, 2005, the Holding Company completed the sale of SSRM Holdings, Inc. (‘‘SSRM’’) to a third party for $328 million of cash and
stock. As a result of the sale of SSRM, the Company recognized income from discontinued operations of approximately $150 million, net of income
taxes, comprised of a realized gain of $166 million, net of income taxes, and an operating expense related to a lease abandonment of $16 million, net of
income taxes. Under the terms of the agreement, MetLife will have an opportunity to receive, prior to the end of 2006, additional payments aggregating
up to approximately 25% of the base purchase price, based on, among other things, certain revenue retention and growth measures. The purchase price
is also subject to reduction over five years, depending on retention of certain MetLife-related business. The Company has reclassified the assets,
liabilities and operations of SSRM into discontinued operations for all periods presented in the consolidated financial statements. Additionally, the sale of
SSRM resulted in the elimination of the Company’s Asset Management segment. The remaining asset management business, which is insignificant, has
been reclassified into Corporate & Other. The Company’s discontinued operations for the year ended December 31, 2004 also includes expenses of
approximately $20 million, net of income taxes, related to the sale of SSRM. See also Note 18.
In 2003, RGA entered into a coinsurance agreement under which it assumed the traditional U.S. life reinsurance business of Allianz Life Insurance
Company of North America. The transaction added approximately $278 billion of life reinsurance in-force, $246 million of premium and $11 million of
income before income tax expense, excluding minority interest expense, in 2003. The effects of such transaction are included within the Reinsurance
segment.
MetLife, Inc.
F-52