MetLife 2004 Annual Report Download - page 66
Download and view the complete annual report
Please find page 66 of the 2004 MetLife annual report below. You can navigate through the pages in the report by either clicking on the pages listed below, or by using the keyword search tool below to find specific information within the annual report.-
 1
1 -
2
-
3
-
4
-
5
-
6
-
7
-
8
-
9
-
10
-
11
-
12
-
13
-
14
-
15
-
16
-
17
-
18
-
19
-
20
-
21
-
22
-
23
-
24
-
25
-
26
-
27
-
28
-
29
-
30
-
31
-
32
-
33
-
34
-
35
-
36
-
37
-
38
-
39
-
40
-
41
-
42
-
43
-
44
-
45
-
46
-
47
-
48
-
49
-
50
-
51
-
52
-
53
-
54
-
55
-
 56
56 -
 57
57 -
 58
58 -
 59
59 -
 60
60 -
 61
61 -
 62
62 -
 63
63 -
 64
64 -
 65
65 -
 66
66 -
 67
67 -
 68
68 -
 69
69 -
 70
70 -
 71
71 -
 72
72 -
 73
73 -
 74
74 -
 75
75 -
 76
76 -
77
-
78
-
79
-
80
-
81
-
82
-
83
-
84
-
85
-
86
-
87
-
88
-
89
-
90
-
91
-
92
-
93
-
94
-
95
-
96
-
97
-
98
-
99
-
100
-
101
 |
 |

METLIFE, INC.
NOTES TO CONSOLIDATED FINANCIAL STATEMENTS — (Continued)
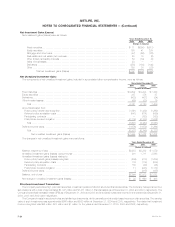
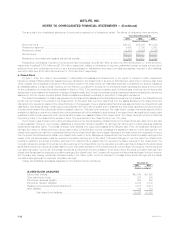
Changes in real estate and real estate joint ventures held-for-sale valuation allowance were as follows:
Years Ended
December 31,
2004 2003 2002
(Dollars in millions)
Balance, beginning of year************************************************************************** $12 $11 $35
Additions **************************************************************************************** 13 17 21
Deductions*************************************************************************************** (21) (16) (45)
Balance, end of year ****************************************************************************** $4 $12 $11
Investment income related to impaired real estate and real estate joint ventures held-for-investment was $15 million, $34 million and $49 million for
the years ended December 31, 2004, 2003 and 2002, respectively. Investment (expense) income related to impaired real estate and real estate joint
ventures held-for-sale was ($1) million, $1 million, and $2 million for the years ended December 31, 2004, 2003 and 2002, respectively. The carrying
value of non-income producing real estate and real estate joint ventures was $41 million and $77 million at December 31, 2004 and 2003, respectively.
The Company owned real estate acquired in satisfaction of debt of $4 million and $3 million at December 31, 2004 and 2003, respectively.
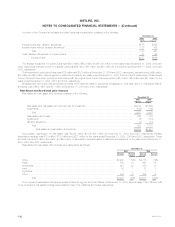
Leveraged Leases
Leveraged leases, included in other invested assets, consisted of the following:
December 31,
2004 2003
(Dollars in millions)
Investment ********************************************************************************** $1,059 $ 974
Estimated residual values ********************************************************************** 480 386
Total *********************************************************************************** 1,539 1,360
Unearned income **************************************************************************** (424) (380)
Leveraged leases ************************************************************************ $1,115 $ 980
The investment amounts set forth above are generally due in monthly installments. The payment periods generally range from one to 15 years, but in
certain circumstances are as long as 30 years. These receivables are generally collateralized by the related property. The Company’s deferred income
tax liability related to leveraged leases was $757 million and $870 million at December 31, 2004 and 2003, respectively.
Funds Withheld at Interest
Included in other invested assets at December 31, 2004 and 2003, were funds withheld at interest of $2,801 million and $2,939 million,
respectively.
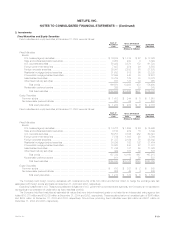
Net Investment Income
The components of net investment income were as follows:
Years Ended December 31,
2004 2003 2002
(Dollars in millions)
Fixed maturities ******************************************************************* $ 9,431 $ 8,817 $ 8,367
Equity securities ****************************************************************** 80 31 43
Mortgage and other loans ********************************************************** 1,963 1,903 1,883
Real estate and real estate joint ventures ********************************************* 953 866 898
Policy loans ********************************************************************** 541 554 543
Other limited partnership interests**************************************************** 324 80 57
Cash, cash equivalents and short-term investments ************************************ 167 171 252
Other *************************************************************************** 124 142 129
Total ************************************************************************ 13,583 12,564 12,172
Less: Investment expenses ********************************************************* 1,165 1,025 989
Net investment income **************************************************** $12,418 $11,539 $11,183
MetLife, Inc. F-23