MetLife 2004 Annual Report Download - page 16
Download and view the complete annual report
Please find page 16 of the 2004 MetLife annual report below. You can navigate through the pages in the report by either clicking on the pages listed below, or by using the keyword search tool below to find specific information within the annual report.-
 1
1 -
2
-
3
-
4
-
5
-
 6
6 -
 7
7 -
 8
8 -
 9
9 -
 10
10 -
 11
11 -
 12
12 -
 13
13 -
 14
14 -
 15
15 -
 16
16 -
 17
17 -
 18
18 -
 19
19 -
 20
20 -
 21
21 -
 22
22 -
 23
23 -
 24
24 -
 25
25 -
 26
26 -
27
-
28
-
29
-
30
-
31
-
32
-
33
-
34
-
35
-
36
-
37
-
38
-
39
-
40
-
41
-
42
-
43
-
44
-
45
-
46
-
47
-
48
-
49
-
50
-
51
-
52
-
53
-
54
-
55
-
56
-
57
-
58
-
59
-
60
-
61
-
62
-
63
-
64
-
65
-
66
-
67
-
68
-
69
-
70
-
71
-
72
-
73
-
74
-
75
-
76
-
77
-
78
-
79
-
80
-
81
-
82
-
83
-
84
-
85
-
86
-
87
-
88
-
89
-
90
-
91
-
92
-
93
-
94
-
95
-
96
-
97
-
98
-
99
-
100
-
101
 |
 |

decrease in expenses was offset by less favorable underwriting results in the traditional and universal life products of $32 million, higher general spending
of $23 million and a $10 million increase in broker/dealer and other subsidiaries related expenses.
Year ended December 31, 2003 compared with the year ended December 31, 2002 — Individual
Income from continuing operations decreased by $55 million, or 9%, to $567 million for the year ended December 31, 2003 from $622 million for
the comparable 2002 period. The decrease year over year is primarily driven by an increase in expenses of $113 million, or 1%, which is largely
attributable to an increase in expenses associated with office closures and other consolidations, pension and postretirement benefit costs, an increase in
legal-related costs and an adjustment related to certain improperly deferred expenses at New England Financial. Although revenues are essentially flat
year over year, policy fees from variable life and annuity and investment-type products grew 15% year over year. In addition, there is a slight increase in
premiums related to other traditional life products. These increases are offset by a 5% decline in premiums from the Company’s closed block business,
which consists of participating policies issued prior to the Company’s demutualization. Premiums on the closed block represent approximately 80% of
this segment’s premiums for the year ended December 31, 2003.
Total revenues, excluding net investment gains and losses, decreased by $7 million, or less than 1%, to $12,534 million for the year ended
December 31, 2003 from $12,541 million for the comparable 2002 period. Policy fees from variable life and annuity and investment-type products grew
by 15% over the prior year period. This growth is primarily a result of an 18% increase in the average separate account balances, which is largely
attributable to improvements in the U.S. financial markets. Additionally, this increase is associated with the aging of the in-force policies, as well as an
increase in the sales of the enterprise variable annuity product through non-traditional distribution channels. Policy fees from variable life and annuity and
investment-type products are typically calculated as a percentage of average assets. The value of these assets can fluctuate depending on equity market
performance. This increase in policy fee income was almost entirely offset by declines in premiums and net investment income. Premiums associated
with the Company’s closed block of business declined by $186 million, or 5%, which is in line with management’s expectations, as this business
continues to run-off. Partially offsetting this decline is a slight increase in the other traditional life products. The decline in net investment income is mainly
due to the change in capital allocation methodology and lower investment yields year over year.
Total expenses increased by $113 million, or 1%, to $11,379 million for the year ended December 31, 2003 from $11,266 million for the
comparable 2002 period. Other expenses increased by $208 million over the prior year period primarily as a result of expenses associated with certain
efficiency initiatives and events. The most significant items include an increase of $67 million from pension and postretirement benefit expense, a
$48 million expense recorded in the second quarter of 2003 for an adjustment related to certain improperly deferred expenses at New England Financial,
$42 million in expenses associated with office closures and other consolidations, $42 million increase in legal-related costs, and other expenses
associated with strategic initiatives at New England Financial. Offsetting these expense increases are a decline in policyholder benefits consistent with the
aforementioned decline in the closed block and a decrease in dividends due to the reduction of the dividend scale in the fourth quarter of 2002, reflecting
the impact of the low U.S. interest rate environment on the asset portfolios supporting these policies.
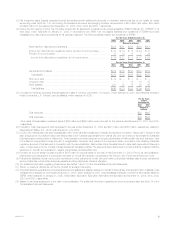
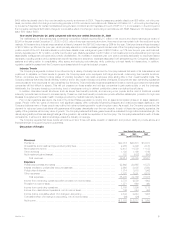
Auto & Home
The following table presents consolidated financial information for the Auto & Home segment for the years indicated:
Year Ended December 31,
2004 2003 2002
(Dollars in millions)
Revenues
Premiums *************************************************************************** $2,948 $2,908 $2,828
Net investment income **************************************************************** 171 158 177
Other revenues ********************************************************************** 35 32 26
Net investment gains (losses) ********************************************************** (9) (15) (46)
Total revenues ******************************************************************* 3,145 3,083 2,985
Expenses
Policyholder benefits and claims ******************************************************** 2,079 2,139 2,019
Policyholder dividends***************************************************************** 21—
Other expenses ********************************************************************** 795 756 793
Total expenses******************************************************************* 2,876 2,896 2,812
Income before provision (benefit) for income taxes ***************************************** 269 187 173
Provision (benefit) for income taxes ****************************************************** 61 30 41
Net income ************************************************************************* $ 208 $ 157 $ 132
Year ended December 31, 2004 compared with the year ended December 31, 2003 — Auto & Home
Net income increased by $51 million, or 32%, to $208 million for the year ended December 31, 2004 from $157 million for the comparable 2003
period. This increase is primarily attributable to an improved non-catastrophe combined ratio, which resulted in a benefit of $52 million, net of income
taxes, improved claim development related to prior accident years of $61 million, net of income taxes, and an increase in net investment income of
$13 million, net of income taxes. Partially offsetting these favorable variances are increased catastrophe losses of $73 million, net of income taxes. This
increase resulted from the four hurricanes that struck the Southeastern United States in August and September of 2004.
Total revenues, excluding net investment gains (losses), increased by $56 million, or 2%, to $3,154 million for the year ended December 31, 2004
from $3,098 million for the comparable 2003 period. This increase is primarily attributable to a $40 million increase in premiums, which is largely the result
of an increase in the average earned premium resulting from continued rate increases. In addition, a $13 million increase in net investment income is
largely attributable to growth in the underlying asset base, an increase in the investment yield and higher income related to tax advantaged municipal
bonds.
Total expenses decreased by $20 million, or 1%, to $2,876 for the year ended December 31, 2004 from $2,896 million for the comparable 2003
period. This decrease is the result of an improvement in policyholder benefits and claims due to a favorable change of $94 million in prior year claim
development, as well as a decrease in expenses of $80 million resulting from an improved non-catastrophe combined ratio primarily attributable to lower
MetLife, Inc. 13