MetLife 2004 Annual Report Download - page 86
Download and view the complete annual report
Please find page 86 of the 2004 MetLife annual report below. You can navigate through the pages in the report by either clicking on the pages listed below, or by using the keyword search tool below to find specific information within the annual report.-
 1
1 -
2
-
3
-
4
-
5
-
6
-
7
-
8
-
9
-
10
-
11
-
12
-
13
-
14
-
15
-
16
-
17
-
18
-
19
-
20
-
21
-
22
-
23
-
24
-
25
-
26
-
27
-
28
-
29
-
30
-
31
-
32
-
33
-
34
-
35
-
36
-
37
-
38
-
39
-
40
-
41
-
42
-
43
-
44
-
45
-
46
-
47
-
48
-
49
-
50
-
51
-
52
-
53
-
54
-
55
-
56
-
57
-
58
-
59
-
60
-
61
-
62
-
63
-
64
-
65
-
66
-
67
-
68
-
69
-
70
-
71
-
72
-
73
-
74
-
75
-
 76
76 -
 77
77 -
 78
78 -
 79
79 -
 80
80 -
 81
81 -
 82
82 -
 83
83 -
 84
84 -
 85
85 -
 86
86 -
 87
87 -
 88
88 -
 89
89 -
 90
90 -
 91
91 -
 92
92 -
 93
93 -
 94
94 -
 95
95 -
 96
96 -
97
-
98
-
99
-
100
-
101
 |
 |

METLIFE, INC.
NOTES TO CONSOLIDATED FINANCIAL STATEMENTS — (Continued)
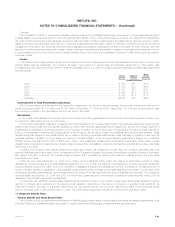
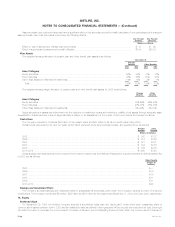
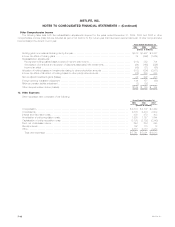
Information for pension and postretirement plans with a projected benefit obligation in excess of plan assets:
December 31,
Pension Benefits Other Benefits
2004 2003 2004 2003
(Dollars in millions)
Projected benefit obligation ********************************************************** $550 $5,229 $1,975 $2,090
Fair value of plan assets ************************************************************ $ 17 $4,673 $1,062 $1,005
As a result of additional pension contributions and favorable investment returns during the year ended December 31, 2004, a significant plan that
was included in the pension benefits section of the above table as of December 31, 2003 was no longer included as of December 31, 2004. This plan
had a fair value of plan assets of $5,316 with a projected benefit obligation of $4,933 and a fair value of plan assets of $4,659 with a projected benefit
obligation of $4,673 as of December 31, 2004 and 2003, respectively.
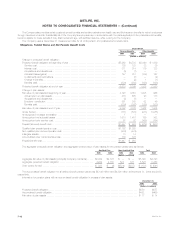
The components of net periodic benefit cost were as follows:
Pension Benefits Other Benefits
2004 2003 2002 2004 2003 2002
(Dollars in millions)
Service cost ********************************************************* $ 129 $ 123 $ 105 $ 32 $ 39 $ 36
Interest cost ********************************************************* 311 314 308 119 123 123
Expected return on plan assets ***************************************** (428) (335) (356) (77) (72) (93)
Amortization of prior actuarial losses (gains) and prior service cost ************ 117 102 33 (12) (12) (9)
Curtailment cost****************************************************** —1011— 3 4
Net periodic benefit cost*********************************************** $ 129 $ 214 $ 101 $ 62 $ 81 $ 61
The Company expects to receive subsidies on prescription drug benefits beginning in 2006 under the Medicare Prescription Drug, Improvement
and Modernization Act of 2003. The postretirement benefit plan assets and accumulated benefit obligation were remeasured effective July 1, 2004 in
order to determine the effect of the expected subsidies on net periodic postretirement benefit cost. As a result, the accumulated postretirement benefit
obligation was reduced $213 million which will be recognized as adjustments of future benefit costs through the amortization of actuarial losses (gains) in
accordance with FASB staff position 106-2 on a prospective basis and net periodic postretirement benefit cost for the year ended 2004 was reduced
$17 million. The reduction of net periodic benefit cost is due to reductions in service cost of $3 million, interest cost of $6 million, and amortization of prior
actuarial loss of $8 million.
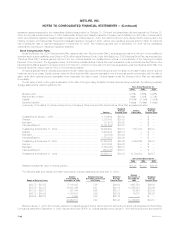
Assumptions
Assumptions used in determining benefit obligations were as follows:
December 31,
Pension Benefits Other Benefits
2004 2003 2004 2003
Weighted average discount rate ******************************************** 5.87% 6.12% 5.88% 6.12%
Rate of compensation increase ******************************************** 3%-8% 3%-8% N/A N/A
Assumptions used in determining net periodic benefit cost were as follows:
December 31,
Pension Benefits Other Benefits
2004 2003 2002 2004 2003 2002
Weighted average discount rate *************************************** 6.10% 6.74% 7.23% 6.20% 6.82% 7.40%
Weighted average expected rate of return on plan assets****************** 8.50% 8.51% 9.00% 7.91% 7.79% 8.16%
Rate of compensation increase **************************************** 3%-8% 3%-8% 2%-8% N/A N/A N/A
The discount rate is based on the yield of a hypothetical portfolio of high-quality debt instruments available on the valuation date, which would
provide the necessary future cash flows to pay the aggregate projected benefit obligation when due. The expected rate of return on plan assets is based
on anticipated performance of the various asset sectors in which the plan invests, weighted by target allocation percentages. Anticipated future
performance is based on long-term historical returns of the plan assets by sector, adjusted for the Company’s long-term expectations on the
performance of the markets. While the precise expected return derived using this approach will fluctuate from year to year, the Company’s policy is to
hold this long-term assumption constant as long as it remains within reasonable tolerance from the derived rate. The weighted expected return on plan
assets for use in that plan’s valuation in 2005 is currently anticipated to be 8.50% for pension benefits and other postretirement medical benefits and
6.25% for postretirement life benefits.
The assumed health care cost trend rates used in measuring the accumulated postretirement benefit obligation were as follows:
December 31,
2004 2003
Pre-Medicare eligible claims ******************************************* 8% down to 5% in 2010 8.5% down to 5% in 2010
Medicare eligible claims *********************************************** 10% down to 5% in 2014 10.5% down to 5% in 2014
MetLife, Inc. F-43