MetLife 2004 Annual Report Download - page 63
Download and view the complete annual report
Please find page 63 of the 2004 MetLife annual report below. You can navigate through the pages in the report by either clicking on the pages listed below, or by using the keyword search tool below to find specific information within the annual report.-
 1
1 -
2
-
3
-
4
-
5
-
6
-
7
-
8
-
9
-
10
-
11
-
12
-
13
-
14
-
15
-
16
-
17
-
18
-
19
-
20
-
21
-
22
-
23
-
24
-
25
-
26
-
27
-
28
-
29
-
30
-
31
-
32
-
33
-
34
-
35
-
36
-
37
-
38
-
39
-
40
-
41
-
42
-
43
-
44
-
45
-
46
-
47
-
48
-
49
-
50
-
51
-
52
-
 53
53 -
 54
54 -
 55
55 -
 56
56 -
 57
57 -
 58
58 -
 59
59 -
 60
60 -
 61
61 -
 62
62 -
 63
63 -
 64
64 -
 65
65 -
 66
66 -
 67
67 -
 68
68 -
 69
69 -
 70
70 -
 71
71 -
 72
72 -
 73
73 -
74
-
75
-
76
-
77
-
78
-
79
-
80
-
81
-
82
-
83
-
84
-
85
-
86
-
87
-
88
-
89
-
90
-
91
-
92
-
93
-
94
-
95
-
96
-
97
-
98
-
99
-
100
-
101
 |
 |

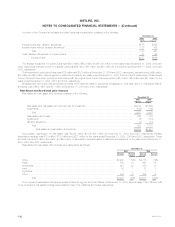
METLIFE, INC.
NOTES TO CONSOLIDATED FINANCIAL STATEMENTS — (Continued)
The cost or amortized cost and estimated fair value of bonds at December 31, 2004, by contractual maturity date (excluding scheduled sinking
funds), are shown below:
Cost or
Amortized Estimated
Cost Fair Value
(Dollars in millions)
Due in one year or less **************************************************************** $ 6,751 $ 6,845
Due after one year through five years ***************************************************** 29,850 31,168
Due after five years through ten years***************************************************** 33,543 36,008
Due after ten years ******************************************************************** 41,960 46,832
Subtotal ********************************************************************* 112,104 120,853
Mortgage-backed and other asset-backed securities **************************************** 54,566 55,607
Subtotal ********************************************************************* 166,670 176,460
Redeemable preferred stock ************************************************************ 326 303
Total fixed maturities *********************************************************** $166,996 $176,763
Bonds not due at a single maturity date have been included in the above table in the year of final contractual maturity. Actual maturities may differ
from contractual maturities due to the exercise of prepayment options.
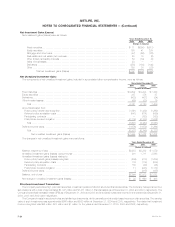
Sales or disposals of fixed maturities and equity securities classified as available-for-sale were as follows:
Years Ended December 31,
2004 2003 2002
(Dollars in millions)
Proceeds ******************************************************************************** $57,604 $54,801 $37,427
Gross investment gains ******************************************************************** $ 844 $ 498 $ 1,661
Gross investment losses ******************************************************************* $ (516) $ (500) $ (979)
Gross investment losses above exclude writedowns recorded during 2004, 2003 and 2002 for other-than-temporarily impaired available-for-sale
fixed maturities and equity securities of $102 million, $355 million and $1,375 million, respectively.
The Company periodically disposes of fixed maturity and equity securities at a loss. Generally, such losses are insignificant in amount or in relation to
the cost basis of the investment or are attributable to declines in fair value occurring in the period of disposition.
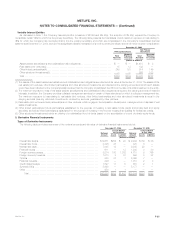
The following table shows the estimated fair values and gross unrealized losses of the Company’s fixed maturities (aggregated by sector) and equity
securities in an unrealized loss position, aggregated by length of time that the securities have been in a continuous unrealized loss position at
December 31, 2004 and 2003:
December 31, 2004
Equal to or Greater
Less than 12 Months than 12 Months Total
Gross Gross Gross
Estimated Unrealized Estimated Unrealized Estimated Unrealized
Fair Value Loss Fair Value Loss Fair Value Loss
(Dollars in millions)
U.S. treasury/agency securities************ $ 5,014 $ 22 $ 4 $ — $ 5,018 $ 22
State and political subdivision securities***** 211 2 72 2 283 4
U.S. corporate securities ***************** 9,963 120 1,211 52 11,174 172
Foreign government securities************* 899 21 117 5 1,016 26
Foreign corporate securities*************** 3,979 71 456 14 4,435 85
Residential mortgage-backed securities ***** 8,545 58 375 7 8,920 65
Commercial mortgage-backed securities **** 3,920 33 225 5 4,145 38
Asset-backed securities ****************** 3,927 25 209 8 4,136 33
Other fixed maturity securities ************* 46 33 26 — 72 33
Total bonds ******************** 36,504 385 2,695 93 39,199 478
Redeemable preferred stocks ************* 303 23 — — 303 23
Total fixed maturities ************* $36,807 $408 $2,695 $ 93 $39,502 $501
Equity securities ************************ $ 136 $ 6 $ 27 $ 2 $ 163 $ 8
Total number of securities in an
unrealized loss position ******** 4,208 402 4,610
MetLife, Inc.
F-20