MetLife 2004 Annual Report Download - page 10
Download and view the complete annual report
Please find page 10 of the 2004 MetLife annual report below. You can navigate through the pages in the report by either clicking on the pages listed below, or by using the keyword search tool below to find specific information within the annual report.-
 1
1 -
 2
2 -
 3
3 -
 4
4 -
 5
5 -
 6
6 -
 7
7 -
 8
8 -
 9
9 -
 10
10 -
 11
11 -
 12
12 -
 13
13 -
 14
14 -
 15
15 -
 16
16 -
 17
17 -
 18
18 -
 19
19 -
 20
20 -
 21
21 -
22
-
23
-
24
-
25
-
26
-
27
-
28
-
29
-
30
-
31
-
32
-
33
-
34
-
35
-
36
-
37
-
38
-
39
-
40
-
41
-
42
-
43
-
44
-
45
-
46
-
47
-
48
-
49
-
50
-
51
-
52
-
53
-
54
-
55
-
56
-
57
-
58
-
59
-
60
-
61
-
62
-
63
-
64
-
65
-
66
-
67
-
68
-
69
-
70
-
71
-
72
-
73
-
74
-
75
-
76
-
77
-
78
-
79
-
80
-
81
-
82
-
83
-
84
-
85
-
86
-
87
-
88
-
89
-
90
-
91
-
92
-
93
-
94
-
95
-
96
-
97
-
98
-
99
-
100
-
101
 |
 |

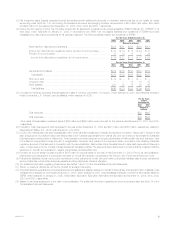
$485 million is primarily due to the more favorable economic environment in 2004. These increases are partially offset by an $86 million, net of income
taxes, cumulative effect of a change in accounting principle in 2004 recorded in accordance with Statement of Position 03-1, Accounting and Reporting
by Insurance Enterprises for Certain Nontraditional Long-Duration Contracts and for Separate Accounts (‘‘SOP 03-1’’). In comparison, in the 2003 period
the Company recorded a $26 million charge for a cumulative effect of a change in accounting in accordance with FASB Statement 133 Implementation
Issue B36 (‘‘Issue B36’’).
Year ended December 31, 2003 compared with the year ended December 31, 2002
The marketplace for financial services is extremely competitive. MetLife reported $2,217 million in net income and diluted earnings per share of
$2.94 for the year ended December 31, 2003. In 2003, after a three-year economic slowdown, there were improvements in both the credit and equity
markets. At the same time, interest rates remained at historic lows and the S&P 500 Index was up 26% for the year. Total premiums and fees increased
to $23.2 billion, up 9% over the prior year, which primarily stems from continued sales growth across most of the Company’s segments, as well as the
positive impact of the U.S. financial markets on policy fees. Assets under management grew to $350.2 billion, up 17% over the prior year, and Individual
annuity deposits grew to $11.2 billion, up 42% over the prior year. MetLife generated over $11 billion of net investment income while adhering to rigorous
asset-liability management principles and portfolio diversification. An increase in expenses year over year is primarily attributable to employee-related
expenses, including pension and postretirement benefit expense and severance, expenses associated with strengthening the Company’s distribution
systems and taking action in consolidating office space and reducing redundancies, while continuing to invest heavily in infrastructure. In addition,
regulatory capital increased and the Company repurchased stock through its buyback program.
Industry Trends
The Company’s segments continue to be influenced by a variety of industry trends and the Company believes that each of its businesses is well
positioned to capitalize on those trends. In general, the Company sees more employers, both large and small, outsourcing their benefits functions.
Further, companies are offering broader arrays of voluntary benefits to help retain employees while adding little to their overall benefits costs. The
Company believes that these trends will likely continue and in fact expand across companies of all sizes. Employers are also demanding substantial
online access for their employees for various self-service functions. This functionality requires substantial information technology investment that smaller
companies will find difficult to absorb. This will put pressure on those smaller and mid-size companies to gain scale quickly or exit the business.
Additionally, the Company is seeing a continuing trend of employers moving to defined contribution plans over defined benefit plans.
In addition, alternative benefit structures, such as simple fixed benefit products, are becoming more popular as the cost of traditional medical
indemnity products has continued to increase rapidly. These low cost fixed benefit products can provide effective catastrophic protection for high cost
illnesses to supplement the basic health coverage provided by medical indemnity insurance.
From a demographics standpoint, the bulk of the United States population is moving from an asset accumulation phase to an asset distribution
phase. People within ten years of retirement hold significant assets. With continually lengthening lifespans and unstructured asset distribution, the
Company believes many of these people may outlive their retirement savings and/or require long-term care. As a result, the Company expects that the
demand for retirement payout solutions with guarantees will increase dramatically over the next decade. In each of these demographic scenarios, the
quality of the guarantee will be a key driver of growth. The Company believes that these guarantees will be evaluated through balance sheet strength, the
claims paying ability and financial strength ratings of the guarantor, as well as the reputation of the Company. The Company believes that in each of these
comparisons, it will be at a distinct advantage versus the industry on average.
The Company expects that these trends will continue to favor those with scale, breadth of distribution and product, ability to provide advice and
financial strength to support long-term guarantees.
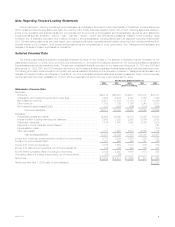
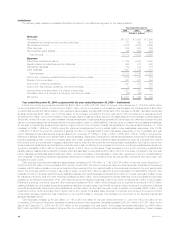
Discussion of Results
Year Ended December 31,
2004 2003 2002
(Dollars in millions)
Revenues
Premiums*********************************************************************** $22,316 $20,673 $19,077
Universal life and investment-type product policy fees ********************************** 2,900 2,496 2,147
Net investment income *********************************************************** 12,418 11,539 11,183
Other revenues ****************************************************************** 1,198 1,199 1,166
Net investment gains (losses) ****************************************************** 182 (582) (892)
Total revenues*************************************************************** 39,014 35,325 32,681
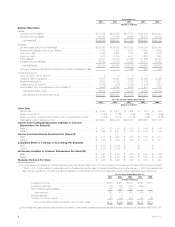
Expenses
Policyholder benefits and claims **************************************************** 22,662 20,665 19,373
Interest credited to policyholder account balances ************************************* 2,998 3,035 2,950
Policyholder dividends ************************************************************ 1,814 1,975 1,942
Other expenses ***************************************************************** 7,761 7,091 6,813
Total expenses ************************************************************** 35,235 32,766 31,078
Income from continuing operations before provision for income taxes ********************* 3,779 2,559 1,603
Provision for income taxes********************************************************* 1,071 660 490
Income from continuing operations************************************************** 2,708 1,899 1,113
Income from discontinued operations, net of income taxes****************************** 136 344 492
Income before cumulative effect of a change in accounting ***************************** 2,844 2,243 1,605
Cumulative effect of a change in accounting, net of income taxes *********************** (86) (26) —
Net income ********************************************************************* $ 2,758 $ 2,217 $ 1,605
MetLife, Inc. 7