MetLife 2004 Annual Report Download - page 32
Download and view the complete annual report
Please find page 32 of the 2004 MetLife annual report below. You can navigate through the pages in the report by either clicking on the pages listed below, or by using the keyword search tool below to find specific information within the annual report.-
 1
1 -
2
-
3
-
4
-
5
-
6
-
7
-
8
-
9
-
10
-
11
-
12
-
13
-
14
-
15
-
16
-
17
-
18
-
19
-
20
-
21
-
 22
22 -
 23
23 -
 24
24 -
 25
25 -
 26
26 -
 27
27 -
 28
28 -
 29
29 -
 30
30 -
 31
31 -
 32
32 -
 33
33 -
 34
34 -
 35
35 -
 36
36 -
 37
37 -
 38
38 -
 39
39 -
 40
40 -
 41
41 -
 42
42 -
43
-
44
-
45
-
46
-
47
-
48
-
49
-
50
-
51
-
52
-
53
-
54
-
55
-
56
-
57
-
58
-
59
-
60
-
61
-
62
-
63
-
64
-
65
-
66
-
67
-
68
-
69
-
70
-
71
-
72
-
73
-
74
-
75
-
76
-
77
-
78
-
79
-
80
-
81
-
82
-
83
-
84
-
85
-
86
-
87
-
88
-
89
-
90
-
91
-
92
-
93
-
94
-
95
-
96
-
97
-
98
-
99
-
100
-
101
 |
 |

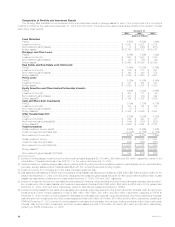
(7) Investment income from other invested assets includes scheduled periodic settlement payments on derivative instruments that do not qualify for
hedge accounting under SFAS 133 of $51 million, $84 million and $32 million for the years ended December 31, 2004, 2003 and 2002,
respectively. These amounts are excluded from net investment gains (losses).
(8) Included in net investment gains (losses) from other invested assets is $0 million, $10 million and $(4) million for the years ended December 31, 2004,
2003 and 2002, respectively, related to discontinued operations pertaining to SSRM.
(9) Included in net investment gains (losses) from other invested assets for the year ended December 31, 2004, is a charge of $26 million related to a
funds withheld reinsurance treaty that was converted to a coinsurance agreement. This amount is classified in net investment income in the
consolidated statements of income.
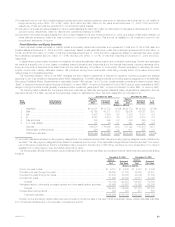
Fixed Maturities and Equity Securities
Fixed maturities consist principally of publicly traded and privately placed debt securities, and represented 73.9% and 75.7% of total cash and
invested assets at December 31, 2004 and 2003, respectively. Based on estimated fair value, public fixed maturities represented $154,456 million, or
87.4%, and $147,489 million, or 87.9%, of total fixed maturities at December 31, 2004 and 2003, respectively. Based on estimated fair value, private
fixed maturities represented $22,307 million, or 12.6%, and $20,263 million, or 12.1%, of total fixed maturities at December 31, 2004 and 2003,
respectively.
In cases where quoted market prices are not available, fair values are estimated using present value or valuation techniques. The fair value estimates
are made at a specific point in time, based on available market information and judgments about the financial instruments, including estimates of the
timing and amounts of expected future cash flows and the credit standing of the issuer or counterparty. Factors considered in estimating fair value
include: coupon rate, maturity, estimated duration, call provisions, sinking fund requirements, credit rating, industry sector of the issuer and quoted
market prices of comparable securities.
The Securities Valuation Office of the NAIC evaluates the fixed maturity investments of insurers for regulatory reporting purposes and assigns
securities to one of six investment categories called ‘‘NAIC designations.’’ The NAIC ratings are similar to the rating agency designations of the Nationally
Recognized Statistical Rating Organizations for marketable bonds. NAIC ratings 1 and 2 include bonds generally considered investment grade (rated
‘‘Baa3’’ or higher by Moody’s Investors Services (‘‘Moody’s’’), or rated ‘‘BBB–’’ or higher by Standard & Poor’s (‘‘S&P’’) by such rating organizations. NAIC
ratings 3 through 6 include bonds generally considered below investment grade (rated ‘‘Ba1’’ or lower by Moody’s, or rated ‘‘BB+’’ or lower by S&P).
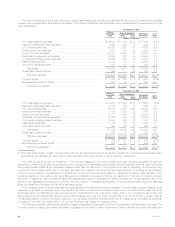
The following table presents the Company’s total fixed maturities by Nationally Recognized Statistical Rating Organizations designation and the
equivalent ratings of the NAIC, as well as the percentage, based on estimated fair value, that each designation is comprised of at:
December 31, 2004 December 31, 2003
Cost or Cost or
NAIC Rating Agency Amortized Estimated % of Amortized Estimated % of
Rating Designation(1) Cost Fair Value Total Cost Fair Value Total
(Dollars in millions)
1 Aaa/Aa/A******************************************* $113,071 $118,779 67.2% $106,779 $112,333 67.0%
2 Baa *********************************************** 42,165 45,311 25.6 39,006 42,057 25.0
3Ba************************************************ 6,907 7,500 4.2 7,388 8,011 4.8
4B************************************************* 4,097 4,414 2.5 3,578 3,814 2.3
5 Caa and lower ************************************** 329 366 0.2 630 629 0.4
6 In or near default ************************************ 101 90 0.1 341 371 0.2
Subtotal******************************************** 166,670 176,460 99.8 157,722 167,215 99.7
Redeemable preferred stock*************************** 326 303 0.2 611 537 0.3
Total fixed maturities********************************** $166,996 $176,763 100.0% $158,333 $167,752 100.0%
(1) Amounts presented are based on rating agency designations. Comparisons between NAIC ratings and rating agency designations are published by
the NAIC. The rating agency designations are based on availability and the lower of the applicable ratings between Moody’s and S&P. The current
period ratings are presented so that the consolidated rating is equal to the Moody’s or S&P rating, whichever is more conservative. If no rating is
available from a rating agency, then the MetLife rating will be used.
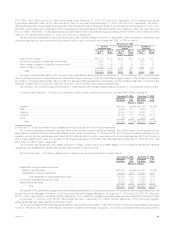
The following table shows the amortized cost and estimated fair value of fixed maturities, by contractual maturity dates (excluding scheduled sinking
funds) at:
December 31, 2004 December 31, 2003
Cost or Cost or
Amortized Estimated Amortized Estimated
Cost Fair Value Cost Fair Value
(Dollars in millions)
Due in one year or less ***************************************************** $ 6,751 $ 6,845 $ 5,381 $ 5,542
Due after one year through five years ****************************************** 29,850 31,168 30,893 32,431
Due after five years through ten years ***************************************** 33,543 36,008 29,342 31,830
Due after ten years ********************************************************* 41,960 46,832 39,011 43,064
Subtotal ************************************************************** 112,104 120,853 104,627 112,867
Mortgage-backed, commercial mortgage-backed and other asset-backed securities ** 54,566 55,607 53,095 54,348
Subtotal ************************************************************** 166,670 176,460 157,722 167,215
Redeemable preferred stock ************************************************* 326 303 611 537
Total fixed maturities **************************************************** $166,996 $176,763 $158,333 $167,752
Bonds not due at a single maturity date have been included in the above table in the year of final contractual maturity. Actual maturities may differ
from contractual maturities due to the exercise of prepayment options.
MetLife, Inc. 29