MetLife 2004 Annual Report Download - page 65
Download and view the complete annual report
Please find page 65 of the 2004 MetLife annual report below. You can navigate through the pages in the report by either clicking on the pages listed below, or by using the keyword search tool below to find specific information within the annual report.-
 1
1 -
2
-
3
-
4
-
5
-
6
-
7
-
8
-
9
-
10
-
11
-
12
-
13
-
14
-
15
-
16
-
17
-
18
-
19
-
20
-
21
-
22
-
23
-
24
-
25
-
26
-
27
-
28
-
29
-
30
-
31
-
32
-
33
-
34
-
35
-
36
-
37
-
38
-
39
-
40
-
41
-
42
-
43
-
44
-
45
-
46
-
47
-
48
-
49
-
50
-
51
-
52
-
53
-
54
-
 55
55 -
 56
56 -
 57
57 -
 58
58 -
 59
59 -
 60
60 -
 61
61 -
 62
62 -
 63
63 -
 64
64 -
 65
65 -
 66
66 -
 67
67 -
 68
68 -
 69
69 -
 70
70 -
 71
71 -
 72
72 -
 73
73 -
 74
74 -
 75
75 -
76
-
77
-
78
-
79
-
80
-
81
-
82
-
83
-
84
-
85
-
86
-
87
-
88
-
89
-
90
-
91
-
92
-
93
-
94
-
95
-
96
-
97
-
98
-
99
-
100
-
101
 |
 |

METLIFE, INC.
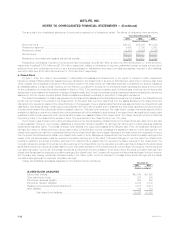
NOTES TO CONSOLIDATED FINANCIAL STATEMENTS — (Continued)
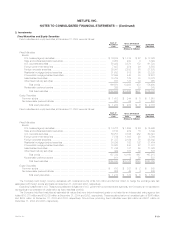
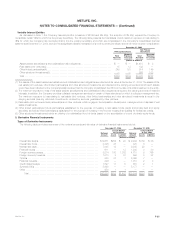
A portion of the Company’s mortgage and other loans was impaired and consisted of the following:
December 31,
2004 2003
(Dollars in millions)
Impaired loans with valuation allowances****************************************************************** $185 $296
Impaired loans without valuation allowances *************************************************************** 133 165
Total **************************************************************************************** 318 461
Less: Valuation allowances on impaired loans ************************************************************* 41 62
Impaired loans ******************************************************************************* $277 $399
The average investment in impaired loans was $404 million, $652 million and $1,088 million for the years ended December 31, 2004, 2003 and
2002, respectively. Interest income on impaired loans was $29 million, $58 million and $91 million for the years ended December 31, 2004, 2003 and
2002, respectively.
The investment in restructured loans was $125 million and $191 million at December 31, 2004 and 2003, respectively. Interest income of $9 million,
$19 million and $44 million was recognized on restructured loans for the years ended December 31, 2004, 2003 and 2002, respectively. Gross interest
income that would have been recorded in accordance with the original terms of such loans amounted to $12 million, $24 million and $41 million for the
years ended December 31, 2004, 2003 and 2002, respectively.
Mortgage and other loans with scheduled payments of 60 days (90 days for agricultural mortgages) or more past due or in foreclosure had an
amortized cost of $58 million and $51 million at December 31, 2004 and 2003, respectively.
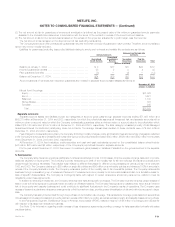
Real Estate and Real Estate Joint Ventures
Real estate and real estate joint ventures consisted of the following:
December 31,
2004 2003
(Dollars in millions)
Real estate and real estate joint ventures held-for-investment **************************************** $4,105 $3,639
Impairments ********************************************************************************* (124) (132)
Total *********************************************************************************** 3,981 3,507
Real estate held-for-sale *********************************************************************** 262 1,333
Impairments ********************************************************************************* (6) (151)
Valuation allowance *************************************************************************** (4) (12)
Total *********************************************************************************** 252 1,170
Real estate and real estate joint ventures ************************************************* $4,233 $4,677
Accumulated depreciation on real estate was $2,005 million and $1,955 million at December 31, 2004 and 2003, respectively. Related
depreciation expense was $179 million, $183 million and $227 million for the years ended December 31, 2004, 2003 and 2002, respectively. These
amounts include $17 million, $39 million and $83 million of depreciation expense related to discontinued operations for the years ended December 31,
2004, 2003 and 2002, respectively.
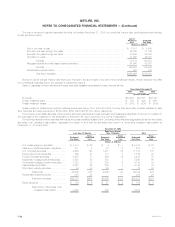
Real estate and real estate joint ventures were categorized as follows:
December 31,
2004 2003
Amount Percent Amount Percent
(Dollars in millions)
Office *************************************************************************** $2,297 54% $2,775 59%
Retail**************************************************************************** 558 13 667 14
Apartments*********************************************************************** 918 22 858 18
Land **************************************************************************** 56 1 81 3
Agriculture *********************************************************************** 1— 1—
Other**************************************************************************** 403 10 295 6
Total ******************************************************************** $4,233 100% $4,677 100%
The Company’s real estate holdings are primarily located throughout the United States. At December 31, 2004, approximately 31%, 21% and 19%
of the Company’s real estate holdings were located in New York, California and Texas, respectively.
MetLife, Inc.
F-22