MetLife 2004 Annual Report Download - page 76
Download and view the complete annual report
Please find page 76 of the 2004 MetLife annual report below. You can navigate through the pages in the report by either clicking on the pages listed below, or by using the keyword search tool below to find specific information within the annual report.-
 1
1 -
2
-
3
-
4
-
5
-
6
-
7
-
8
-
9
-
10
-
11
-
12
-
13
-
14
-
15
-
16
-
17
-
18
-
19
-
20
-
21
-
22
-
23
-
24
-
25
-
26
-
27
-
28
-
29
-
30
-
31
-
32
-
33
-
34
-
35
-
36
-
37
-
38
-
39
-
40
-
41
-
42
-
43
-
44
-
45
-
46
-
47
-
48
-
49
-
50
-
51
-
52
-
53
-
54
-
55
-
56
-
57
-
58
-
59
-
60
-
61
-
62
-
63
-
64
-
65
-
 66
66 -
 67
67 -
 68
68 -
 69
69 -
 70
70 -
 71
71 -
 72
72 -
 73
73 -
 74
74 -
 75
75 -
 76
76 -
 77
77 -
 78
78 -
 79
79 -
 80
80 -
 81
81 -
 82
82 -
 83
83 -
 84
84 -
 85
85 -
 86
86 -
87
-
88
-
89
-
90
-
91
-
92
-
93
-
94
-
95
-
96
-
97
-
98
-
99
-
100
-
101
 |
 |

METLIFE, INC.
NOTES TO CONSOLIDATED FINANCIAL STATEMENTS — (Continued)
December 31,
2004 2003
(Dollars in millions)
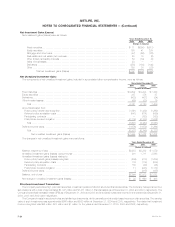
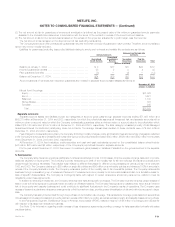
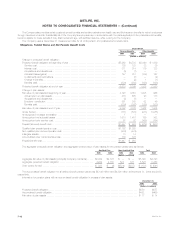
ASSETS DESIGNATED TO THE CLOSED BLOCK
Investments:
Fixed maturities available-for-sale, at fair value (amortized cost: $27,757 and $30,381, respectively) **** 29,766 32,348
Equity securities, at fair value (cost: $898 and $217, respectively)********************************* 979 250
Mortgage loans on real estate *************************************************************** 8,165 7,431
Policy loans ****************************************************************************** 4,067 4,036
Short-term investments********************************************************************* 101 123
Other invested assets********************************************************************** 221 108
Total investments******************************************************************** 43,299 44,296
Cash and cash equivalents ******************************************************************* 325 531
Accrued investment income******************************************************************* 511 527
Deferred income taxes *********************************************************************** 1,002 1,043
Premiums and other receivables *************************************************************** 103 164
Total assets designated to the closed block ********************************************* 45,240 46,561
Excess of closed block liabilities over assets designated to the closed block************************** 4,785 5,037
Amounts included in accumulated other comprehensive loss:
Net unrealized investment gains, net of deferred income tax of $752 and $730, respectively ********** 1,338 1,270
Unrealized derivative gains (losses), net of deferred income tax benefit of ($31) and ($28), respectively ** (55) (48)
Allocated from policyholder dividend obligation, net of deferred income tax benefit of ($763) and ($778),
respectively **************************************************************************** (1,356) (1,352)
(73) (130)
Maximum future earnings to be recognized from closed block assets and liabilities********************* $ 4,712 $ 4,907
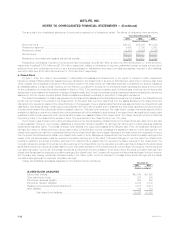
Information regarding the policyholder dividend obligation is as follows:
Years Ended December 31
2004 2003 2002
(Dollars in millions)
Balance at beginning of year ******************************************************************* $2,130 $1,882 $ 708
Impact on revenues, net of expenses and income taxes ******************************************** 124 — —
Change in unrealized investment and derivative gains (losses) *************************************** (11) 248 1,174
Balance at end of year ************************************************************************ $2,243 $2,130 $1,882
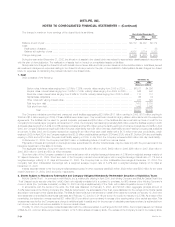
Closed block revenues and expenses were as follows:
Years Ended December 31,
2004 2003 2002
(Dollars in millions)
REVENUES
Premiums *********************************************************************************** $3,156 $3,365 $3,551
Net investment income and other revenues******************************************************* 2,504 2,554 2,568
Net investment gains (losses) ****************************************************************** (19) (128) 11
Total revenues *********************************************************************** 5,641 5,791 6,130
EXPENSES
Policyholder benefits and claims **************************************************************** 3,480 3,660 3,770
Policyholder dividends************************************************************************* 1,458 1,509 1,573
Change in policyholder dividend obligation******************************************************** 124 — —
Other expenses ****************************************************************************** 275 297 310
Total expenses*********************************************************************** 5,337 5,466 5,653
Revenues net of expenses before income taxes*************************************************** 304 325 477
Income taxes ******************************************************************************** 109 118 173
Revenues net of expenses and income taxes ***************************************************** $ 195 $ 207 $ 304
MetLife, Inc. F-33