MetLife 2004 Annual Report Download - page 5
Download and view the complete annual report
Please find page 5 of the 2004 MetLife annual report below. You can navigate through the pages in the report by either clicking on the pages listed below, or by using the keyword search tool below to find specific information within the annual report.-
 1
1 -
 2
2 -
 3
3 -
 4
4 -
 5
5 -
 6
6 -
 7
7 -
 8
8 -
 9
9 -
 10
10 -
 11
11 -
 12
12 -
 13
13 -
 14
14 -
 15
15 -
 16
16 -
17
-
18
-
19
-
20
-
21
-
22
-
23
-
24
-
25
-
26
-
27
-
28
-
29
-
30
-
31
-
32
-
33
-
34
-
35
-
36
-
37
-
38
-
39
-
40
-
41
-
42
-
43
-
44
-
45
-
46
-
47
-
48
-
49
-
50
-
51
-
52
-
53
-
54
-
55
-
56
-
57
-
58
-
59
-
60
-
61
-
62
-
63
-
64
-
65
-
66
-
67
-
68
-
69
-
70
-
71
-
72
-
73
-
74
-
75
-
76
-
77
-
78
-
79
-
80
-
81
-
82
-
83
-
84
-
85
-
86
-
87
-
88
-
89
-
90
-
91
-
92
-
93
-
94
-
95
-
96
-
97
-
98
-
99
-
100
-
101
 |
 |

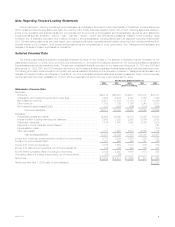
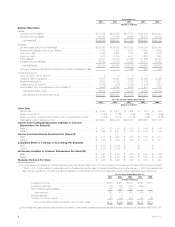
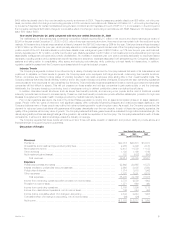
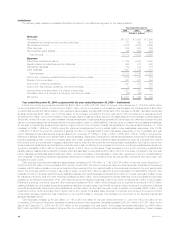
At December 31,
2004 2003 2002 2001 2000
(Dollars in millions)
Balance Sheet Data
Assets:
General account assets******************************************** $270,039 $251,085 $217,733 $194,256 $183,912
Separate account assets******************************************* 86,769 75,756 59,693 62,714 70,250
Total assets(4) ************************************************** $356,808 $326,841 $277,426 $256,970 $254,162
Liabilities:
Life and health policyholder liabilities(9) ******************************* $190,847 $176,628 $162,569 $148,395 $140,040
Property and casualty policyholder liabilities**************************** 3,180 2,943 2,673 2,610 2,559
Short-term debt ************************************************** 1,445 3,642 1,161 355 1,085
Long-term debt*************************************************** 7,412 5,703 4,411 3,614 2,353
Other liabilities **************************************************** 44,331 41,020 28,269 21,964 20,396
Separate account liabilities ***************************************** 86,769 75,756 59,693 62,714 70,250
Total liabilities(4)************************************************* 333,984 305,692 258,776 239,652 236,683
Company-obligated mandatorily redeemable securities of subsidiary trusts** — — 1,265 1,256 1,090
Stockholders’ Equity:
Common stock, at par value(10) ************************************ 88888
Additional paid-in capital(10) **************************************** 15,037 14,991 14,968 14,966 14,926
Retained earnings(10)********************************************** 6,608 4,193 2,807 1,349 1,021
Treasury stock, at cost(10) ***************************************** (1,785) (835) (2,405) (1,934) (613)
Accumulated other comprehensive income (loss)(10) ******************* 2,956 2,792 2,007 1,673 1,047
Total stockholders’ equity***************************************** 22,824 21,149 17,385 16,062 16,389
Total liabilities and stockholders’ equity ***************************** $356,808 $326,841 $277,426 $256,970 $254,162
At or for the Years Ended December 31,
2004 2003 2002 2001 2000
(Dollars in millions)
Other Data
Net income ****************************************************** $ 2,758 $ 2,217 $ 1,605 $ 473 $ 953
Return on equity(11)*********************************************** 12.5% 11.5% 9.6% 2.9% 6.3%
Return on equity, excluding accumulated other comprehensive income **** 14.4% 13.1% 10.8% 3.2% 12.1%
Total assets under management(12)********************************** $386,951 $350,235 $299,187 $282,486 $301,325
Income from Continuing Operations Available to Common
Shareholders Per Share(13)
Basic *********************************************************** $ 3.61 $ 2.55 $ 1.58 $ 0.46 $ 1.41
Diluted ********************************************************** $ 3.59 $ 2.51 $ 1.53 $ 0.45 $ 1.39
Income from Discontinued Operations Per Share(13)
Basic *********************************************************** $ 0.18 $ 0.47 $ 0.70 $ 0.18 $ 0.11
Diluted ********************************************************** $ 0.18 $ 0.46 $ 0.67 $ 0.18 $ 0.11
Cumulative Effect of a Change in Accounting Per Share(13)
Basic *********************************************************** $ (0.11) $ (0.04) $ — $ — $ —
Diluted ********************************************************** $ (0.11) $ (0.03) $ — $ — $ —
Net Income Available to Common Shareholders Per Share(13)
Basic *********************************************************** $ 3.68 $ 2.98 $ 2.28 $ 0.64 $ 1.52
Diluted ********************************************************** $ 3.65 $ 2.94 $ 2.20 $ 0.62 $ 1.49
Dividends Declared Per Share ************************************* $ 0.46 $ 0.23 $ 0.21 $ 0.20 $ 0.20
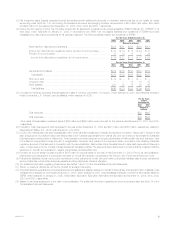
(1) In accordance with Statement of Financial Accounting Standards (‘‘SFAS’’) No. 144, Accounting for the Impairment or Disposal of Long-Lived Assets
(‘‘SFAS 144’’), income related to real estate sold or classified as held-for-sale for transactions initiated on or after January 1, 2002 is presented as
discontinued operations. The following table presents the components of income from discontinued real estate operations (see footnote 4):
For the Years Ended December 31,
2004 2003 2002 2001 2000
(Dollars in millions)
Investment income ************************************************ $136 $ 231 $ 530 $ 525 $177
Investment expense *********************************************** (82) (138) (351) (339) —
Net investment gains (losses) *************************************** 139 420 582 — —
Total revenues************************************************** 193 513 761 186 177
Interest expense ************************************************** 13 4 1 — —
Provision for income taxes****************************************** 63 186 276 68 65
Income from discontinued operations, net of income taxes************* $117 $ 323 $ 484 $ 118 $112
(2) Net investment gains (losses) exclude amounts related to real estate operations reported as discontinued operations in accordance with SFAS 144.
MetLife, Inc.
2