MetLife 2004 Annual Report Download - page 31
Download and view the complete annual report
Please find page 31 of the 2004 MetLife annual report below. You can navigate through the pages in the report by either clicking on the pages listed below, or by using the keyword search tool below to find specific information within the annual report.-
 1
1 -
2
-
3
-
4
-
5
-
6
-
7
-
8
-
9
-
10
-
11
-
12
-
13
-
14
-
15
-
16
-
17
-
18
-
19
-
20
-
 21
21 -
 22
22 -
 23
23 -
 24
24 -
 25
25 -
 26
26 -
 27
27 -
 28
28 -
 29
29 -
 30
30 -
 31
31 -
 32
32 -
 33
33 -
 34
34 -
 35
35 -
 36
36 -
 37
37 -
 38
38 -
 39
39 -
 40
40 -
 41
41 -
42
-
43
-
44
-
45
-
46
-
47
-
48
-
49
-
50
-
51
-
52
-
53
-
54
-
55
-
56
-
57
-
58
-
59
-
60
-
61
-
62
-
63
-
64
-
65
-
66
-
67
-
68
-
69
-
70
-
71
-
72
-
73
-
74
-
75
-
76
-
77
-
78
-
79
-
80
-
81
-
82
-
83
-
84
-
85
-
86
-
87
-
88
-
89
-
90
-
91
-
92
-
93
-
94
-
95
-
96
-
97
-
98
-
99
-
100
-
101
 |
 |

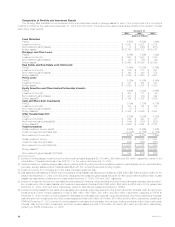
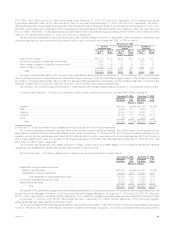
Composition of Portfolio and Investment Results
The following table illustrates the net investment income and annualized yields on average assets for each of the components of the Company’s
investment portfolio for the years ended December 31, 2004, 2003 and 2002. The decline in annualized yields is due primarily to the decline in interest
rates during these periods.
December 31,
2004 2003 2002
(Dollars in millions)
Fixed Maturities
Yield(2) ****************************************************************************** 6.55% 6.89% 7.46%
Investment income********************************************************************* $ 9,042 $ 8,502 $ 8,076
Net investment gains (losses) ************************************************************ $ 71 $ (398) $ (917)
Ending assets************************************************************************* $176,763 $167,752 $140,288
Mortgage and Other Loans
Yield(2) ****************************************************************************** 6.86% 7.48% 7.84%
Investment income(3)******************************************************************* $ 1,961 $ 1,903 $ 1,883
Net investment gains (losses) ************************************************************ $ (47) $ (56) $ (22)
Ending assets************************************************************************* $ 32,406 $ 26,249 $ 25,086
Real Estate and Real Estate Joint Ventures(4)
Yield(2) ****************************************************************************** 11.64% 10.90% 11.48%
Investment income(5)******************************************************************* $ 516 $ 513 $ 637
Net investment gains (losses) ************************************************************ $ 162 $ 440 $ 576
Ending assets(6)*********************************************************************** $ 4,329 $ 4,680 $ 4,637
Policy Loans
Yield(2) ****************************************************************************** 6.15% 6.40% 6.49%
Investment income********************************************************************* $ 541 $ 554 $ 543
Ending assets************************************************************************* $ 8,899 $ 8,749 $ 8,580
Equity Securities and Other Limited Partnership Interests
Yield(2) ****************************************************************************** 9.90% 3.02% 2.66%
Investment income(5)******************************************************************* $ 404 $ 111 $ 99
Net investment gains (losses) ************************************************************ $ 208 $ (43) $ 222
Ending assets(6)*********************************************************************** $ 5,144 $ 4,198 $ 4,096
Cash and Short-Term Investments
Yield(2) ****************************************************************************** 2.99% 2.73% 4.17%
Investment income(5)******************************************************************* $ 153 $ 165 $ 232
Net investment gains (losses) ************************************************************ $(1)$ 1$—
Ending assets(6)*********************************************************************** $ 6,802 $ 5,559 $ 4,244
Other Invested Assets(7)
Yield(2) ****************************************************************************** 6.38% 8.53% 8.82%
Investment income(5)******************************************************************* $ 259 $ 290 $ 218
Net investment gains (losses)(8)(9) ******************************************************** $ (149) $ (180) $ (206)
Ending assets(6)*********************************************************************** $ 4,946 $ 4,645 $ 3,727
Total Investments
Gross investment income yield(2) ******************************************************** 6.67% 6.86% 7.40%
Investment fees and expenses yield ****************************************************** (0.14)% (0.15)% (0.15)%
Net investment income yield************************************************************* 6.53% 6.71% 7.25%
Gross investment income *************************************************************** $ 12,876 $ 12,038 $ 11,688
Investment fees and expenses*********************************************************** (262) (266) (235)
Net investment income(1)(4)(5)(7)(9)******************************************************* $ 12,614 $ 11,772 $ 11,453
Ending assets(1)*********************************************************************** $239,289 $221,832 $190,658
Net investment gains (losses)(1)(4)(7)(8)(9) ************************************************* $ 244 $ (236) $ (347)
(1) Included in ending assets, investment income and investment gains (losses) is $2,139 million, $86 million and $25 million, respectively, related to the
consolidation of separate accounts under SOP 03-1 for the year ended December 31, 2004.
(2) Yields are based on quarterly average asset carrying values, excluding recognized and unrealized investment gains (losses), and for yield calculation
purposes, average assets exclude collateral associated with the Company’s securities lending program.
(3) Investment income from mortgage and other loans includes prepayment fees.
(4) Real estate and real estate joint venture income includes amounts classified as discontinued operations of $54 million, $93 million and $180 million for the
years ended December 31, 2004, 2003 and 2002, respectively. Net investment gains (losses) include $139 million, $420 million and $582 million of gains
classified as discontinued operations for the years ended December 31, 2004, 2003 and 2002, respectively.
(5) Included in investment income from real estate and real estate joint ventures, equity securities and other limited partnership interests, cash and short-
term investments, other invested assets, and investment expenses and fees is a total of $65 million, $56 million and $59 million for the years ended
December 31, 2004, 2003 and 2002, respectively, related to discontinued operations pertaining to SSRM.
(6) Included in ending assets for real estate and real estate joint ventures, equity securities and other limited partnership interests, cash and short-term
investments and other invested assets is a total of $96 million, $49 million, $88 million and $20 million, respectively, pertaining to SSRM at
December 31, 2004. Included in ending assets for real estate and real estate joint ventures, equity securities and other limited partnership interests,
cash and short-term investments, and other invested assets is a total of $3 million, $14 million, $67 million and $8 million, respectively, pertaining to
SSRM at December 31, 2003. Included in ending assets for real estate and real estate joint ventures, equity securities and other limited partnership
interests, cash and short-term investments, and other invested assets is a total of $19 million, $7 million, $54 million and $5 million, respectively,
pertaining to SSRM at December 31, 2002.
MetLife, Inc.
28