MetLife 2004 Annual Report Download - page 13
Download and view the complete annual report
Please find page 13 of the 2004 MetLife annual report below. You can navigate through the pages in the report by either clicking on the pages listed below, or by using the keyword search tool below to find specific information within the annual report.-
 1
1 -
2
-
 3
3 -
 4
4 -
 5
5 -
 6
6 -
 7
7 -
 8
8 -
 9
9 -
 10
10 -
 11
11 -
 12
12 -
 13
13 -
 14
14 -
 15
15 -
 16
16 -
 17
17 -
 18
18 -
 19
19 -
 20
20 -
 21
21 -
 22
22 -
 23
23 -
24
-
25
-
26
-
27
-
28
-
29
-
30
-
31
-
32
-
33
-
34
-
35
-
36
-
37
-
38
-
39
-
40
-
41
-
42
-
43
-
44
-
45
-
46
-
47
-
48
-
49
-
50
-
51
-
52
-
53
-
54
-
55
-
56
-
57
-
58
-
59
-
60
-
61
-
62
-
63
-
64
-
65
-
66
-
67
-
68
-
69
-
70
-
71
-
72
-
73
-
74
-
75
-
76
-
77
-
78
-
79
-
80
-
81
-
82
-
83
-
84
-
85
-
86
-
87
-
88
-
89
-
90
-
91
-
92
-
93
-
94
-
95
-
96
-
97
-
98
-
99
-
100
-
101
 |
 |

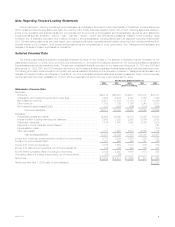
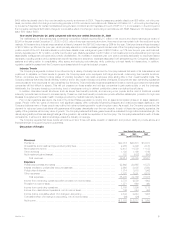
Institutional
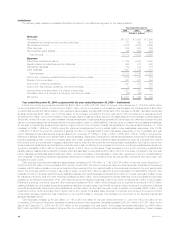
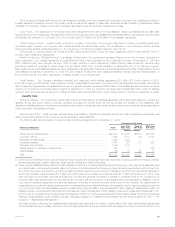
The following table presents consolidated financial information for the Institutional segment for the years indicated:
Year Ended December 31,
2004 2003 2002
(Dollars in millions)
Revenues
Premiums************************************************************************ $10,103 $ 9,093 $ 8,245
Universal life and investment-type product policy fees *********************************** 717 635 624
Net investment income ************************************************************ 4,472 4,028 3,909
Other revenues ******************************************************************* 632 592 609
Net investment gains (losses) ******************************************************* 186 (293) (488)
Total revenues****************************************************************** 16,110 14,055 12,899
Expenses
Policyholder benefits and claims ***************************************************** 11,134 9,843 9,345
Interest credited to policyholder account balances ************************************** 960 915 932
Policyholder dividends ************************************************************* 107 198 115
Other expenses ****************************************************************** 1,907 1,784 1,531
Total expenses ***************************************************************** 14,108 12,740 11,923
Income from continuing operations before provision for income taxes ********************** 2,002 1,315 976
Provision for income taxes********************************************************** 681 477 344
Income from continuing operations*************************************************** 1,321 838 632
Income from discontinued operations, net of income taxes******************************* 10 37 127
Income before cumulative effect of a change in accounting ****************************** 1,331 875 759
Cumulative effect of a change in accounting, net of income taxes ************************ (60) (26) —
Net income ********************************************************************** $ 1,271 $ 849 $ 759
Year ended December 31, 2004 compared with the year ended December 31, 2003 — Institutional
Income from continuing operations increased by $483 million, or 58%, to $1,321 million for the year ended December 31, 2004 from $838 million
for the comparable 2003 period. An improvement of $241 million, net of income taxes, in net investment gains (losses), net of adjustments of $63 million
to policyholder benefit and claims related to net investment gains (losses), is a significant component of the increase. In addition, favorable interest rate
spreads contributed $225 million, net of income taxes, to the increase compared to the prior year period, with the retirement & savings products
generating $183 million, net of income taxes, of this increase. Higher investment yields, growth in the asset base and lower average crediting rates are
the primary drivers of the year over year increase in interest rate spreads. These spreads are generally the percentage point difference between the yield
earned on invested assets and the interest rate the Company uses to credit on certain liabilities. Therefore, given a constant value of assets and liabilities,
an increase in interest rate spreads would result in higher income to the Company. Interest rate spreads for the year ended December 31, 2004
increased to 2.06%, 1.66% and 1.88% for group life, retirement & savings and the non-medical health & other businesses, respectively, from 2.04%,
1.40% and 1.51% for the group life, retirement & savings, and the non-medical health & other businesses, respectively, in the comparable prior year
period. Management generally expects these spreads to be in the range of 1.60% to 1.80%, 1.30% to 1.45%, and 1.30% to 1.50% for the group life,
retirement & savings, and the non-medical health & other businesses, respectively. Earnings from interest rate spreads are influenced by several factors,
including business growth, movement in interest rates, and certain investment and investment-related transactions, such as corporate joint venture
income and bond and commercial mortgage prepayment fees for which the timing and amount are generally unpredictable. As a result, income from
these investment transactions may fluctuate from period to period. Also contributing to the increase in income from continuing operations is a reduction in
a premium tax liability of $31 million in the second quarter of 2004, net of income taxes. These increases in income from continuing operations are
partially offset by less favorable underwriting results, which are estimated to have declined $30 million, net of income taxes, compared to the prior year
period. Management attributes approximately $20 million, net of income taxes, of this decrease to mixed claim experience in the non-medical health &
other business. Underwriting results are significantly influenced by mortality and morbidity trends, as well as claim experience and, as a result, can
fluctuate from year to year.
Total revenues, excluding net investment gains (losses), increased by $1,576 million, or 11%, to $15,924 million for the year ended December 31,
2004 from $14,348 million for the comparable 2003 period. Growth of $1,132 million in premiums, fees, and other revenues contributed to the revenue
increase. A $480 million increase in premiums, fees and other revenues in the non-medical health & other business compared to the prior year is partly
due to the continued growth in long-term care of $148 million, of which $41 million is related to the 2004 acquisition of TIAA/CREF’s long-term care
business. Growth in the small market products, disability business, and dental business contributed $305 million to the year over year increase. Group
life insurance premiums, fees and other revenues increased by $461 million, which management primarily attributes to improved sales and favorable
persistency, as well as the acquisition of the John Hancock group life insurance business in late 2003, which contributed $20 million to the increase.
Retirement & savings’ premiums, fees and other revenues increased by $191 million, which is largely due to a growth in premiums of $172 million,
resulting primarily from an increase in structured settlement sales and pension close-outs. Premiums, fees and other revenues from retirement & savings
products are significantly influenced by large transactions, and as a result, can fluctuate from year to year. In addition, an increase of $444 million in net
investment income, which is primarily due to higher income from growth in the asset base, earnings on corporate joint venture income and bond and
commercial mortgage prepayment fees contributed to the overall increase in revenues. This increase is a component of the favorable interest rate
spreads discussed above.
Total expenses increased by $1,368 million, or 11%, to $14,108 million for the year ended December 31, 2004 from $12,740 million for the
comparable 2003 period. Policyholder benefits and claims combined with policyholder dividends increased by $1,200 million to $11,241 million for the
year ended December 31, 2004 from $10,041 million for the comparable prior year period. This increase is primarily attributable to a $459 million,
$461 million, and $280 million increase in the group life, non-medical health & other and retirement & savings businesses, respectively. These increases
MetLife, Inc.
10