MetLife 2004 Annual Report Download - page 68
Download and view the complete annual report
Please find page 68 of the 2004 MetLife annual report below. You can navigate through the pages in the report by either clicking on the pages listed below, or by using the keyword search tool below to find specific information within the annual report.-
 1
1 -
2
-
3
-
4
-
5
-
6
-
7
-
8
-
9
-
10
-
11
-
12
-
13
-
14
-
15
-
16
-
17
-
18
-
19
-
20
-
21
-
22
-
23
-
24
-
25
-
26
-
27
-
28
-
29
-
30
-
31
-
32
-
33
-
34
-
35
-
36
-
37
-
38
-
39
-
40
-
41
-
42
-
43
-
44
-
45
-
46
-
47
-
48
-
49
-
50
-
51
-
52
-
53
-
54
-
55
-
56
-
57
-
 58
58 -
 59
59 -
 60
60 -
 61
61 -
 62
62 -
 63
63 -
 64
64 -
 65
65 -
 66
66 -
 67
67 -
 68
68 -
 69
69 -
 70
70 -
 71
71 -
 72
72 -
 73
73 -
 74
74 -
 75
75 -
 76
76 -
 77
77 -
 78
78 -
79
-
80
-
81
-
82
-
83
-
84
-
85
-
86
-
87
-
88
-
89
-
90
-
91
-
92
-
93
-
94
-
95
-
96
-
97
-
98
-
99
-
100
-
101
 |
 |

METLIFE, INC.
NOTES TO CONSOLIDATED FINANCIAL STATEMENTS — (Continued)
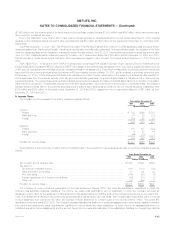
Variable Interest Entities
As discussed in Note 1, the Company has adopted the provisions of FIN 46 and FIN 46(r). The adoption of FIN 46(r) required the Company to
consolidate certain VIEs for which it is the primary beneficiary. The following table presents the total assets of and maximum exposure to loss relating to
VIEs for which the Company has concluded that (i) it is the primary beneficiary and which are consolidated in the Company’s consolidated financial
statements at December 31, 2004, and (ii) it holds significant variable interests but it is not the primary beneficiary and which have not been consolidated:
December 31, 2004
Not Primary
Primary Beneficiary Beneficiary
Maximum Maximum
Total Exposure Total Exposure
Assets(1) to Loss(2) Assets(1) to Loss(2)
(Dollars in millions)
Asset-backed securitizations and collateralized debt obligations ************************** $ — $ — $1,418 $ 3
Real estate joint ventures(3) ******************************************************** 15 13 132 —
Other limited partnerships(4)******************************************************** 249 191 914 146
Other structured investments(5) ***************************************************** — — 856 103
Total *************************************************************************** $264 $204 $3,320 $252
(1) The assets of the asset-backed securitizations and collateralized debt obligations are reflected at fair value at December 31, 2004. The assets of the
real estate joint ventures, other limited partnerships and other structured investments are reflected at the carrying amounts at which such assets
would have been reflected on the Company’s balance sheet had the Company consolidated the VIE from the date of its initial investment in the entity.
(2) The maximum exposure to loss of the asset-backed securitizations and collateralized debt obligations is equal to the carrying amounts of retained
interests. In addition, the Company provides collateral management services for certain of these structures for which it collects a management fee.
The maximum exposure to loss relating to real estate joint ventures, other limited partnerships and other structured investments is equal to the
carrying amounts plus any unfunded commitments, reduced by amounts guaranteed by other partners.
(3) Real estate joint ventures include partnerships and other ventures, which engage in the acquisition, development, management and disposal of real
estate investments.
(4) Other limited partnerships include partnerships established for the purpose of investing in real estate funds, public and private debt and equity
securities, as well as limited partnerships established for the purpose of investing in low-income housing that qualifies for federal tax credits.
(5) Other structured investments include an offering of a collateralized fund of funds based on the securitization of a pool of private equity funds.
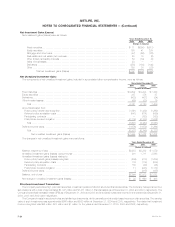
3. Derivative Financial Instruments
Types of Derivative Instruments
The following table provides a summary of the notional amounts and fair value of derivative financial instruments held at:
December 31, 2004 December 31, 2003
Current Market Current Market
or Fair Value or Fair Value
Notional Notional
Amount Assets Liabilities Amount Assets Liabilities
(Dollars in millions)
Interest rate swaps **************************************************** $12,681 $284 $ 22 $ 9,944 $189 $ 36
Interest rate floors ***************************************************** 3,325 38 — 325 5 —
Interest rate caps ***************************************************** 7,045 12 — 9,345 29 —
Financial futures ****************************************************** 611 — 13 1,348 8 30
Foreign currency swaps************************************************ 8,214 150 1,302 4,710 9 796
Foreign currency forwards ********************************************** 1,013 5 57 695 5 32
Options ************************************************************* 825 37 7 6,065 7 —
Financial forwards ***************************************************** 326 — — 1,310 2 3
Credit default swaps ************************************************** 1,897 11 5 615 2 1
Synthetic GICs ******************************************************* 5,869 — — 5,177 — —
Other *************************************************************** 450 1 1 — — —
Total ************************************************************ $42,256 $538 $1,407 $39,534 $256 $898
MetLife, Inc. F-25