MetLife 2004 Annual Report Download - page 15
Download and view the complete annual report
Please find page 15 of the 2004 MetLife annual report below. You can navigate through the pages in the report by either clicking on the pages listed below, or by using the keyword search tool below to find specific information within the annual report.-
 1
1 -
2
-
3
-
4
-
 5
5 -
 6
6 -
 7
7 -
 8
8 -
 9
9 -
 10
10 -
 11
11 -
 12
12 -
 13
13 -
 14
14 -
 15
15 -
 16
16 -
 17
17 -
 18
18 -
 19
19 -
 20
20 -
 21
21 -
 22
22 -
 23
23 -
 24
24 -
 25
25 -
26
-
27
-
28
-
29
-
30
-
31
-
32
-
33
-
34
-
35
-
36
-
37
-
38
-
39
-
40
-
41
-
42
-
43
-
44
-
45
-
46
-
47
-
48
-
49
-
50
-
51
-
52
-
53
-
54
-
55
-
56
-
57
-
58
-
59
-
60
-
61
-
62
-
63
-
64
-
65
-
66
-
67
-
68
-
69
-
70
-
71
-
72
-
73
-
74
-
75
-
76
-
77
-
78
-
79
-
80
-
81
-
82
-
83
-
84
-
85
-
86
-
87
-
88
-
89
-
90
-
91
-
92
-
93
-
94
-
95
-
96
-
97
-
98
-
99
-
100
-
101
 |
 |

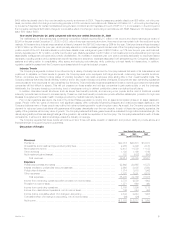
Individual
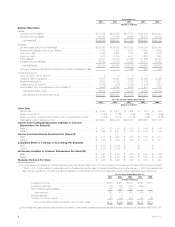
The following table presents consolidated financial information for the Individual segment for the years indicated:
Year Ended December 31,
2004 2003 2002
(Dollars in millions)
Revenues
Premiums************************************************************************ $ 4,172 $ 4,344 $ 4,507
Universal life and investment-type product policy fees *********************************** 1,831 1,589 1,379
Net investment income ************************************************************ 6,130 6,194 6,237
Other revenues ******************************************************************* 444 407 418
Net investment gains (losses) ******************************************************* 74 (307) (290)
Total revenues**************************************************************** 12,651 12,227 12,251
Expenses
Policyholder benefits and claims ***************************************************** 5,102 5,039 5,064
Interest credited to policyholder account balances ************************************** 1,674 1,793 1,793
Policyholder dividends ************************************************************* 1,638 1,700 1,770
Other expenses ****************************************************************** 2,939 2,847 2,639
Total expenses *************************************************************** 11,353 11,379 11,266
Income from continuing operations before provision for income taxes ********************** 1,298 848 985
Provision for income taxes********************************************************** 431 281 363
Income from continuing operations*************************************************** 867 567 622
Income from discontinued operations, net of income taxes******************************* 3 34 204
Net income ********************************************************************** $ 870 $ 601 $ 826
Year ended December 31, 2004 compared with the year ended December 31, 2003 — Individual
Income from continuing operations increased by $300 million, or 53%, to $867 million for the year ended December 31, 2004 from $567 million for
the comparable 2003 period. Included in this increase is an improvement in net investment gains (losses) of $242 million, net of income taxes. This
increase includes additional fee income of $154 million, net of income taxes, primarily related to separate account products. In addition, improvement in
interest rate spreads contributed $77 million, net of income taxes, to the year over year increase. These spreads are generally the percentage point
difference between the yield earned on invested assets and the interest rate the Company uses to credit on certain liabilities. Therefore, given a constant
value of assets and liabilities, an increase in interest rate spreads would result in higher income to the Company. Interest rate spreads include income
from certain investment transactions, including corporate joint venture income and bond and commercial mortgage prepayment fees, the timing and
amount of which are generally unpredictable. As a result, income from these investment transactions may fluctuate from year to year. These types of
investment transactions contributed $38 million, net of income taxes, to the improvement in interest rate spreads. Additionally, the charge of $31 million,
net of income taxes, in 2003 related to certain improperly deferred expenses at New England Financial, and a reduction in policyholder dividends of
$39 million, net of income taxes, in 2004 contributed to the increase in income from continuing operations. These increases in income from continuing
operations are partially offset by a reduction in earnings of $78 million, net of income taxes, resulting from an increase in the closed block-related
policyholder dividend obligation, associated primarily with an improvement in net investment gains (losses). Higher DAC amortization of $74 million, net of
income taxes, also increased expenses for the year ended December 31, 2004. Additionally, offsetting these increases are lower net investment income
on traditional life and income annuity products of $43 million, net of income taxes. The application of SOP 03-1 and the corresponding cost of hedging
guaranteed annuity benefit riders reduced earnings by $30 million, net of income taxes. In addition, less favorable underwriting results in the traditional
and universal life products of $20 million, net of income taxes, and higher general spending of $15 million, net of income taxes, added to this offset.
These underwriting results are significantly influenced by mortality experience and the reinsurance activity related to certain blocks of business, and as a
result can fluctuate from year to year.
Total revenues, excluding net investment gains (losses), increased by $43 million, or less than 1%, to $12,577 million for the year ended
December 31, 2004 from $12,534 million for the comparable 2003 period. This increase includes higher fee income primarily from separate account
products of $252 million resulting from a combination of growth in the business and improved overall market performance. Policy fees from variable life
and annuity and investment-type products are typically calculated as a percentage of the average assets in policyholder accounts. The value of these
assets can fluctuate depending on equity performance. In addition, management attributes higher premiums of $37 million in 2004 to the active
marketing of income annuity products. The increased volume of sales in 2004 also resulted in higher broker/dealer and other subsidiaries revenues of
$27 million. Partially offsetting the increases in total revenues for the year ended December 31, 2004 are lower premiums related to the Company’s
closed block of business of $209 million, which continues to run off at management’s expected range of 3% to 6% per year. In addition, lower net
investment income of $64 million resulting from lower investment yields offset other increases in revenues.
Total expenses decreased by $26 million, or less than 1%, to $11,353 million for the year ended December 31, 2004 from $11,379 million for the
comparable 2003 period. Lower expenses are primarily the result of a $181 million decrease in the closed block policyholder benefits partially attributable
to lower activity associated with the run off of this business and a $119 million decline in interest credited to policyholder account balances due to lower
crediting rates. Also included in the decrease in expenses are lower policyholder dividends of $62 million resulting from reductions in the dividend scale in
late 2003 and a charge in 2003 related to certain improperly deferred expenses at New England Financial of $48 million. Partially offsetting these
decreases in expenses is a $123 million increase in the closed block-related policyholder dividend obligation based on positive performance of the
closed block and higher DAC amortization of $116 million. The increase in DAC amortization is a result of accelerated amortization resulting from
improvement in net investment gains (losses) and the update of management’s assumptions used to determine estimated gross margins. Additionally,
offsetting the decrease to expenses is a $46 million increase from the application of SOP 03-1 and the corresponding cost of hedging guaranteed
annuity benefit riders and a $35 million increase in future policy benefits commensurate with the increase in income annuity premiums. Further, the
MetLife, Inc.
12