MetLife 2004 Annual Report Download - page 50
Download and view the complete annual report
Please find page 50 of the 2004 MetLife annual report below. You can navigate through the pages in the report by either clicking on the pages listed below, or by using the keyword search tool below to find specific information within the annual report.-
 1
1 -
2
-
3
-
4
-
5
-
6
-
7
-
8
-
9
-
10
-
11
-
12
-
13
-
14
-
15
-
16
-
17
-
18
-
19
-
20
-
21
-
22
-
23
-
24
-
25
-
26
-
27
-
28
-
29
-
30
-
31
-
32
-
33
-
34
-
35
-
36
-
37
-
38
-
39
-
 40
40 -
 41
41 -
 42
42 -
 43
43 -
 44
44 -
 45
45 -
 46
46 -
 47
47 -
 48
48 -
 49
49 -
 50
50 -
 51
51 -
 52
52 -
 53
53 -
 54
54 -
 55
55 -
 56
56 -
 57
57 -
 58
58 -
 59
59 -
 60
60 -
61
-
62
-
63
-
64
-
65
-
66
-
67
-
68
-
69
-
70
-
71
-
72
-
73
-
74
-
75
-
76
-
77
-
78
-
79
-
80
-
81
-
82
-
83
-
84
-
85
-
86
-
87
-
88
-
89
-
90
-
91
-
92
-
93
-
94
-
95
-
96
-
97
-
98
-
99
-
100
-
101
 |
 |

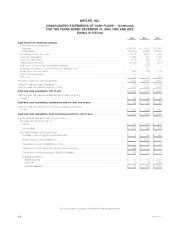
METLIFE, INC.
CONSOLIDATED STATEMENTS OF CASH FLOWS
FOR THE YEARS ENDED DECEMBER 31, 2004, 2003 AND 2002
(Dollars in millions)
2004 2003 2002
Cash flows from operating activities
Net income************************************************************************************ $ 2,758 $ 2,217 $ 1,605
Adjustments to reconcile net income to net cash provided by operating activities:
Depreciation and amortization expenses******************************************************** 441 478 498
Amortization of premiums and accretion of discounts associated with investments, net***************** (110) (180) (519)
(Gains) losses from sales of investments and businesses, net ************************************* (302) 152 317
Interest credited to other policyholder account balances ****************************************** 2,998 3,035 2,950
Universal life and investment-type product policy fees ******************************************** (2,900) (2,496) (2,147)
Change in premiums and other receivables ***************************************************** 78 (334) (473)
Change in deferred policy acquisition costs, net ************************************************* (1,331) (1,332) (741)
Change in insurance-related liabilities ********************************************************** 5,330 4,687 3,104
Change in income taxes payable ************************************************************* (135) 241 479
Change in other assets********************************************************************** (178) (374) (1,071)
Change in other liabilities ******************************************************************** 1,682 1,131 104
Other, net ********************************************************************************* (265) (195) 74
Net cash provided by operating activities *********************************************************** 8,066 7,030 4,180
Cash flows from investing activities
Sales, maturities and repayments of:
Fixed maturities **************************************************************************** 87,451 76,200 64,602
Equity securities**************************************************************************** 1,686 612 2,703
Mortgage and other loans ******************************************************************* 3,954 3,483 2,638
Real estate and real estate joint ventures ******************************************************* 1,214 866 831
Other limited partnership interests ************************************************************* 799 331 213
Purchases of:
Fixed maturities **************************************************************************** (94,275) (101,532) (85,155)
Equity securities**************************************************************************** (2,178) (232) (1,260)
Mortgage and other loans ******************************************************************* (9,931) (4,975) (3,206)
Real estate and real estate joint ventures ******************************************************* (619) (289) (148)
Other limited partnership interests ************************************************************* (894) (643) (516)
Net change in short-term investments *********************************************************** (740) 98 (477)
Purchase of businesses, net of cash received of $0, $27 and $71, respectively ************************ (7) 18 (879)
Proceeds from sales of businesses ************************************************************* 29 5 —
Net change in payable under securities loaned transactions ***************************************** 1,595 9,221 5,201
Net change in other invested assets************************************************************* (958) (629) (451)
Other, net *********************************************************************************** (141) (222) (309)
Net cash used in investing activities *************************************************************** $(13,015) $ (17,688) $(16,213)
See accompanying notes to consolidated financial statements.
MetLife, Inc. F-7