MetLife 2004 Annual Report Download - page 62
Download and view the complete annual report
Please find page 62 of the 2004 MetLife annual report below. You can navigate through the pages in the report by either clicking on the pages listed below, or by using the keyword search tool below to find specific information within the annual report.-
 1
1 -
2
-
3
-
4
-
5
-
6
-
7
-
8
-
9
-
10
-
11
-
12
-
13
-
14
-
15
-
16
-
17
-
18
-
19
-
20
-
21
-
22
-
23
-
24
-
25
-
26
-
27
-
28
-
29
-
30
-
31
-
32
-
33
-
34
-
35
-
36
-
37
-
38
-
39
-
40
-
41
-
42
-
43
-
44
-
45
-
46
-
47
-
48
-
49
-
50
-
51
-
 52
52 -
 53
53 -
 54
54 -
 55
55 -
 56
56 -
 57
57 -
 58
58 -
 59
59 -
 60
60 -
 61
61 -
 62
62 -
 63
63 -
 64
64 -
 65
65 -
 66
66 -
 67
67 -
 68
68 -
 69
69 -
 70
70 -
 71
71 -
 72
72 -
73
-
74
-
75
-
76
-
77
-
78
-
79
-
80
-
81
-
82
-
83
-
84
-
85
-
86
-
87
-
88
-
89
-
90
-
91
-
92
-
93
-
94
-
95
-
96
-
97
-
98
-
99
-
100
-
101
 |
 |

METLIFE, INC.
NOTES TO CONSOLIDATED FINANCIAL STATEMENTS — (Continued)
2. Investments
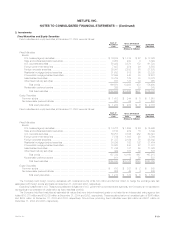
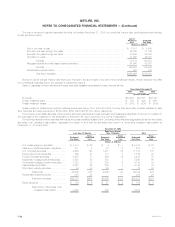
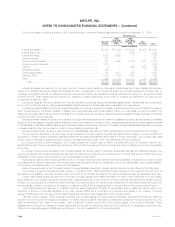
Fixed Maturities and Equity Securities
Fixed maturities and equity securities at December 31, 2004 were as follows:
Cost or Gross Unrealized
Amortized Estimated
Cost Gain Loss Fair Value
(Dollars in millions)
Fixed Maturities:
Bonds:
U.S. treasury/agency securities ********************************************* $ 16,534 $ 1,314 $ 22 $ 17,826
State and political subdivision securities ************************************** 3,683 220 4 3,899
U.S. corporate securities ************************************************** 58,022 3,870 172 61,720
Foreign government securities ********************************************** 7,637 974 26 8,585
Foreign corporate securities ************************************************ 25,341 2,582 85 27,838
Residential mortgage-backed securities ************************************** 31,683 612 65 32,230
Commercial mortgage-backed securities ************************************* 12,099 440 38 12,501
Asset-backed securities *************************************************** 10,784 125 33 10,876
Other fixed maturity securities ********************************************** 887 131 33 985
Total bonds ********************************************************* 166,670 10,268 478 176,460
Redeemable preferred stocks ********************************************** 326 — 23 303
Total fixed maturities ************************************************** $166,996 $10,268 $501 $176,763
Equity Securities:
Common stocks *********************************************************** $ 1,412 $ 244 $ 5 $ 1,651
Nonredeemable preferred stocks ********************************************* 501 39 3 537
Total equity securities ************************************************* $ 1,913 $ 283 $ 8 $ 2,188
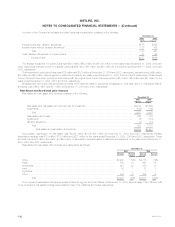
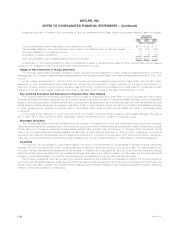
Fixed maturities and equity securities at December 31, 2003 were as follows:
Cost or Gross Unrealized
Amortized Estimated
Cost Gain Loss Fair Value
(Dollars in millions)
Fixed Maturities:
Bonds:
U.S. treasury/agency securities ********************************************* $ 14,707 $ 1,264 $ 26 $ 15,945
State and political subdivision securities ************************************** 3,155 209 15 3,349
U.S. corporate securities ************************************************** 56,757 3,886 252 60,391
Foreign government securities ********************************************** 7,789 1,003 28 8,764
Foreign corporate securities ************************************************ 21,727 2,194 79 23,842
Residential mortgage-backed securities ************************************** 30,836 720 102 31,454
Commercial mortgage-backed securities ************************************* 10,523 530 22 11,031
Asset-backed securities *************************************************** 11,736 187 60 11,863
Other fixed maturity securities ********************************************** 492 167 83 576
Total bonds ********************************************************* 157,722 10,160 667 167,215
Redeemable preferred stocks ********************************************** 611 2 76 537
Total fixed maturities ************************************************** $158,333 $10,162 $743 $167,752
Equity Securities:
Common stocks *********************************************************** $ 613 $ 327 $ 2 $ 938
Nonredeemable preferred stocks ********************************************* 602 48 4 646
Total equity securities ************************************************* $ 1,215 $ 375 $ 6 $ 1,584
The Company held foreign currency derivatives with notional amounts of $4,720 million and $3,502 million to hedge the exchange rate risk
associated with foreign bonds and loans at December 31, 2004 and 2003, respectively.
Excluding investments in U.S. Treasury securities and obligations of U.S. government corporations and agencies, the Company is not exposed to
any significant concentration of credit risk in its fixed maturities portfolio.
The Company held fixed maturities at estimated fair values that were below investment grade or not rated by an independent rating agency that
totaled $12,370 million and $12,825 million at December 31, 2004 and 2003, respectively. These securities had a net unrealized gain of $936 million
and $888 million at December 31, 2004 and 2003, respectively. Non-income producing fixed maturities were $90 million and $371 million at
December 31, 2004 and 2003, respectively.
MetLife, Inc. F-19