MetLife 2004 Annual Report Download - page 33
Download and view the complete annual report
Please find page 33 of the 2004 MetLife annual report below. You can navigate through the pages in the report by either clicking on the pages listed below, or by using the keyword search tool below to find specific information within the annual report.-
 1
1 -
2
-
3
-
4
-
5
-
6
-
7
-
8
-
9
-
10
-
11
-
12
-
13
-
14
-
15
-
16
-
17
-
18
-
19
-
20
-
21
-
22
-
 23
23 -
 24
24 -
 25
25 -
 26
26 -
 27
27 -
 28
28 -
 29
29 -
 30
30 -
 31
31 -
 32
32 -
 33
33 -
 34
34 -
 35
35 -
 36
36 -
 37
37 -
 38
38 -
 39
39 -
 40
40 -
 41
41 -
 42
42 -
 43
43 -
44
-
45
-
46
-
47
-
48
-
49
-
50
-
51
-
52
-
53
-
54
-
55
-
56
-
57
-
58
-
59
-
60
-
61
-
62
-
63
-
64
-
65
-
66
-
67
-
68
-
69
-
70
-
71
-
72
-
73
-
74
-
75
-
76
-
77
-
78
-
79
-
80
-
81
-
82
-
83
-
84
-
85
-
86
-
87
-
88
-
89
-
90
-
91
-
92
-
93
-
94
-
95
-
96
-
97
-
98
-
99
-
100
-
101
 |
 |

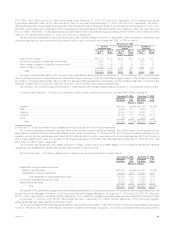
The following tables set forth the cost or amortized cost, gross unrealized gain and loss, and estimated fair value of the Company’s fixed maturities
by sector and equity securities, as well as the percentage of the total fixed maturities holdings that each sector represents and the percentage of the total
equity securities at:
December 31, 2004
Cost or Gross Unrealized
Amortized Estimated % of
Cost Gain Loss Fair Value Total
(Dollars in millions)
U.S. treasury/agency securities ******************************************** $ 16,534 $ 1,314 $ 22 $ 17,826 10.1%
State and political subdivision securities ************************************* 3,683 220 4 3,899 2.2
U.S. corporate securities ************************************************* 58,022 3,870 172 61,720 34.9
Foreign government securities ********************************************* 7,637 974 26 8,585 4.9
Foreign corporate securities *********************************************** 25,341 2,582 85 27,838 15.7
Residential mortgage-backed securities ************************************* 31,683 612 65 32,230 18.2
Commercial mortgage-backed securities ************************************ 12,099 440 38 12,501 7.1
Asset-backed securities ************************************************** 10,784 125 33 10,876 6.1
Other fixed maturity securities ********************************************* 887 131 33 985 0.6
Total bonds ******************************************************** 166,670 10,268 478 176,460 99.8
Redeemable preferred stocks ********************************************* 326 — 23 303 0.2
Total fixed maturities ************************************************* $166,996 $10,268 $501 $176,763 100.0%
Common stocks ******************************************************** $ 1,412 $ 244 $ 5 $ 1,651 75.5%
Nonredeemable preferred stocks ****************************************** 501 39 3 537 24.5
Total equity securities(1) ********************************************** $ 1,913 $ 283 $ 8 $ 2,188 100.0%
December 31, 2003
Cost or Gross Unrealized
Amortized Estimated % of
Cost Gain Loss Fair Value Total
(Dollars in millions)
U.S. treasury/agency securities ******************************************** $ 14,707 $ 1,264 $ 26 $ 15,945 9.5%
State and political subdivision securities ************************************* 3,155 209 15 3,349 2.0
U.S. corporate securities ************************************************* 56,757 3,886 252 60,391 36.0
Foreign government securities ********************************************* 7,789 1,003 28 8,764 5.2
Foreign corporate securities *********************************************** 21,727 2,194 79 23,842 14.2
Residential mortgage-backed securities ************************************* 30,836 720 102 31,454 18.8
Commercial mortgage-backed securities ************************************ 10,523 530 22 11,031 6.6
Asset-backed securities ************************************************** 11,736 187 60 11,863 7.1
Other fixed maturity securities ********************************************* 492 167 83 576 0.3
Total bonds ******************************************************** 157,722 10,160 667 167,215 99.7
Redeemable preferred stocks ********************************************* 611 2 76 537 0.3
Total fixed maturities ************************************************* $158,333 $10,162 $743 $167,752 100.0%
Common stocks ******************************************************** $ 613 $ 327 $ 2 $ 938 59.2%
Nonredeemable preferred stocks ****************************************** 602 48 4 646 40.8
Total equity securities(1) ********************************************** $ 1,215 $ 375 $ 6 $ 1,584 100.0%
(1) Equity securities primarily consist of investments in common and preferred stocks and mutual fund interests. Such securities include private equity
securities with an estimated fair value of $332 million and $432 million at December 31, 2004 and 2003, respectively.
Fixed Maturity and Equity Security Impairment. The Company classifies all of its fixed maturities and equity securities as available-for-sale and
marks them to market through other comprehensive income, except for non-marketable private equities, which are generally carried at cost. All securities
with gross unrealized losses at the consolidated balance sheet date are subjected to the Company’s process for identifying other-than-temporary
impairments. The Company writes down to fair value securities that it deems to be other-than-temporarily impaired in the period the securities are
deemed to be so impaired. The assessment of whether such impairment has occurred is based on management’s case-by-case evaluation of the
underlying reasons for the decline in fair value. Management considers a wide range of factors, as described in ‘‘Summary of Critical Accounting
Estimates — Investments,’’ about the security issuer and uses its best judgment in evaluating the cause of the decline in the estimated fair value of the
security and in assessing the prospects for near-term recovery. Inherent in management’s evaluation of the security are assumptions and estimates
about the operations of the issuer and its future earnings potential.
The Company’s review of its fixed maturities and equity securities for impairments includes an analysis of the total gross unrealized losses by three
categories of securities: (i) securities where the estimated fair value had declined and remained below cost or amortized cost by less than 20%;
(ii) securities where the estimated fair value had declined and remained below cost or amortized cost by 20% or more for less than six months; and
(iii) securities where the estimated fair value had declined and remained below cost or amortized cost by 20% or more for six months or greater. While all
of these securities are monitored for potential impairment, the Company’s experience indicates that the first two categories do not present as great a risk
of impairment, and often, fair values recover over time as the factors that caused the declines improve.
The Company records impairments as investment losses and adjusts the cost basis of the fixed maturities and equity securities accordingly. The
Company does not change the revised cost basis for subsequent recoveries in value. Impairments of fixed maturities and equity securities were
MetLife, Inc.
30