MetLife 2004 Annual Report Download - page 67
Download and view the complete annual report
Please find page 67 of the 2004 MetLife annual report below. You can navigate through the pages in the report by either clicking on the pages listed below, or by using the keyword search tool below to find specific information within the annual report.-
 1
1 -
2
-
3
-
4
-
5
-
6
-
7
-
8
-
9
-
10
-
11
-
12
-
13
-
14
-
15
-
16
-
17
-
18
-
19
-
20
-
21
-
22
-
23
-
24
-
25
-
26
-
27
-
28
-
29
-
30
-
31
-
32
-
33
-
34
-
35
-
36
-
37
-
38
-
39
-
40
-
41
-
42
-
43
-
44
-
45
-
46
-
47
-
48
-
49
-
50
-
51
-
52
-
53
-
54
-
55
-
56
-
 57
57 -
 58
58 -
 59
59 -
 60
60 -
 61
61 -
 62
62 -
 63
63 -
 64
64 -
 65
65 -
 66
66 -
 67
67 -
 68
68 -
 69
69 -
 70
70 -
 71
71 -
 72
72 -
 73
73 -
 74
74 -
 75
75 -
 76
76 -
 77
77 -
78
-
79
-
80
-
81
-
82
-
83
-
84
-
85
-
86
-
87
-
88
-
89
-
90
-
91
-
92
-
93
-
94
-
95
-
96
-
97
-
98
-
99
-
100
-
101
 |
 |

METLIFE, INC.
NOTES TO CONSOLIDATED FINANCIAL STATEMENTS — (Continued)
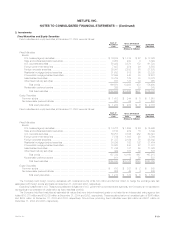
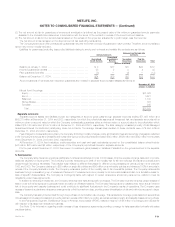
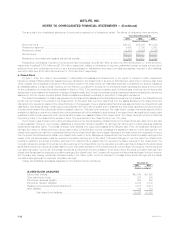
Net Investment Gains (Losses)
Net investment gains (losses) were as follows:
Years Ended December 31,
2004 2003 2002
(Dollars in millions)
Fixed maturities************************************************************************** $ 71 $(398) $(917)
Equity securities ************************************************************************* 155 41 224
Mortgage and other loans ***************************************************************** (47) (56) (22)
Real estate and real estate joint ventures **************************************************** 23 19 (6)
Other limited partnership interests ********************************************************** 53 (84) (2)
Sales of businesses********************************************************************** 23 — —
Derivatives ****************************************************************************** (255) (134) (140)
Other ********************************************************************************** 159 30 (29)
Total net investment gains (losses) ************************************************** $ 182 $(582) $(892)
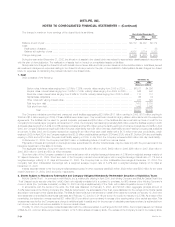
Net Unrealized Investment Gains
The components of net unrealized investment gains, included in accumulated other comprehensive income, were as follows:
Years Ended December 31,
2004 2003 2002
(Dollars in millions)
Fixed maturities***************************************************************************** $ 9,602 $ 9,204 $ 7,360
Equity securities **************************************************************************** 287 376 57
Derivatives ********************************************************************************* (503) (427) (24)
Other invested assets *********************************************************************** (65) (33) 16
Total ********************************************************************************** 9,321 9,120 7,409
Amounts allocated from:
Future policy benefit loss recognition ********************************************************* (1,991) (1,482) (1,269)
Deferred policy acquisition costs ************************************************************ (541) (674) (559)
Participating contracts ********************************************************************* — (183) (153)
Policyholder dividend obligation ************************************************************* (2,119) (2,130) (1,882)
Total ********************************************************************************** (4,651) (4,469) (3,863)
Deferred income taxes*********************************************************************** (1,676) (1,679) (1,264)
Total ********************************************************************************** (6,327) (6,148) (5,127)
Net unrealized investment gains (losses) ************************************************ $ 2,994 $ 2,972 $ 2,282
The changes in net unrealized investment gains were as follows:
Years Ended December 31,
2004 2003 2002
(Dollars in millions)
Balance, beginning of year ******************************************************************** $2,972 $2,282 $ 1,879
Unrealized investment gains (losses) during the year *********************************************** 201 1,711 3,565
Unrealized investment gains (losses) relating to:
Future policy benefit gains (losses) recognition ************************************************** (509) (213) (1,239)
Deferred policy acquisition costs ************************************************************* 133 (115) (538)
Participating contracts ********************************************************************** 183 (30) (26)
Policyholder dividend obligation ************************************************************** 11 (248) (1,174)
Deferred income taxes************************************************************************ 3 (415) (185)
Balance, end of year ************************************************************************* $2,994 $2,972 $ 2,282
Net change in unrealized investment gains (losses) ************************************************ $ 22 $ 690 $ 403
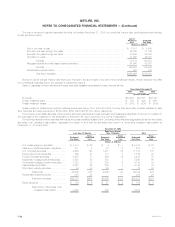
Structured Investment Transactions
The Company securitizes high yield debt securities, investment grade bonds and structured finance securities. The Company has sponsored four
securitizations with a total of approximately $1,341 million and $1,431 million in financial assets as of December 31, 2004 and 2003, respectively. The
Company’s beneficial interests in these SPEs as of December 31, 2004 and 2003 and the related investment income for the years ended December 31,
2004, 2003 and 2002 were insignificant.
The Company invests in structured notes and similar type instruments, which generally provide equity-based returns on debt securities. The carrying
value of such investments was approximately $666 million and $880 million at December 31, 2004 and 2003, respectively. The related net investment
income recognized was $45 million, $78 million and $1 million for the years ended December 31, 2004, 2003 and 2002, respectively.
MetLife, Inc.
F-24