MetLife 2004 Annual Report Download - page 24
Download and view the complete annual report
Please find page 24 of the 2004 MetLife annual report below. You can navigate through the pages in the report by either clicking on the pages listed below, or by using the keyword search tool below to find specific information within the annual report.-
 1
1 -
2
-
3
-
4
-
5
-
6
-
7
-
8
-
9
-
10
-
11
-
12
-
13
-
 14
14 -
 15
15 -
 16
16 -
 17
17 -
 18
18 -
 19
19 -
 20
20 -
 21
21 -
 22
22 -
 23
23 -
 24
24 -
 25
25 -
 26
26 -
 27
27 -
 28
28 -
 29
29 -
 30
30 -
 31
31 -
 32
32 -
 33
33 -
 34
34 -
35
-
36
-
37
-
38
-
39
-
40
-
41
-
42
-
43
-
44
-
45
-
46
-
47
-
48
-
49
-
50
-
51
-
52
-
53
-
54
-
55
-
56
-
57
-
58
-
59
-
60
-
61
-
62
-
63
-
64
-
65
-
66
-
67
-
68
-
69
-
70
-
71
-
72
-
73
-
74
-
75
-
76
-
77
-
78
-
79
-
80
-
81
-
82
-
83
-
84
-
85
-
86
-
87
-
88
-
89
-
90
-
91
-
92
-
93
-
94
-
95
-
96
-
97
-
98
-
99
-
100
-
101
 |
 |
Other. Based on management’s analysis of its expected cash inflows from operating activities, the dividends it receives from subsidiaries, including
Metropolitan Life, that are permitted to be paid without prior insurance regulatory approval and its portfolio of liquid assets and other anticipated cash
flows, management believes there will be sufficient liquidity to enable the Company to make payments on debt, make cash dividend payments on its
common stock, pay all operating expenses, and meet its cash needs. The nature of the Company’s diverse product portfolio and customer base lessens
the likelihood that normal operations will result in any significant strain on liquidity.
Subsequent Events. See ‘‘—The Holding Company — Liquidity Uses — Subsequent Events.’’
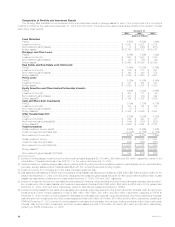
Consolidated cash flows. Net cash provided by operating activities was $8,066 million and $7,030 million for the years ended December 31, 2004
and 2003, respectively. The $1,036 million increase in operating cash flows in 2004 over the comparable 2003 period is primarily attributable to
continued growth in the group life, long-term care, dental and disability businesses, as well as an increase in retirement & savings’ structured settlements
due to a large multi-contract sale in 2004. Also, the late 2003 acquisition of John Hancock’s group life business and the acquisition of TIAA-CREF’s long-
term care business contributed to growth in the 2004 period. In addition, an increase in MetLife Bank’s customer deposits, particularly in the personal
and business savings accounts, contributed to the increase in operating cash flows.
Net cash provided by operating activities was $7,030 million and $4,180 million for the years ended December 31, 2003 and 2002, respectively.
The $2,850 million increase in operating cash flow in 2003 over the comparable 2002 period is primarily attributable to sales growth in the group life,
dental, disability and long-term care businesses, as well as higher sales in retirement & savings’ structured settlement products. The acquisition of John
Hancock’s group business also contributed to sales growth in the 2003 period. In addition, growth in MetLife Bank’s customer deposits, accelerated
prepayments of mortgage-backed securities that have been previously purchased at a premium, and an increase in funds withheld related to reinsurance
activity contributed to the increase in operating cash flows. These items were partially offset by the Company’s contribution to its qualified defined benefit
plans in December 2003.
Net cash used in investing activities was $13,015 million and $17,688 million for the years ended December 31, 2004 and 2003, respectively. The
$4,673 million decrease in net cash used in investing activities in 2004 over the comparable 2003 period is primarily due to less cash provided by
financing activities, partially offset by an increase in cash generated from operations. This decrease in available cash resulted in reduced investments in
fixed maturities for the current year versus the prior year. Additionally, there was a decrease in securities lending cash collateral invested in 2004 as
compared to 2003. These items are partially offset by an increase in mortgage and other loan origination as the Company continues to take advantage of
favorable market conditions in this sector as well as an increase in cash used for equity securities and short-term investments for the comparable
periods.
Net cash used in investing activities was $17,688 million and $16,213 million for the years ended December 31, 2003 and 2002, respectively. The
$1,475 million increase in net cash used in investing activities in 2003 over the comparable 2002 period is primarily attributable to an increase in the
purchase of fixed maturities and commercial mortgage loan origination, as well as an increase in the amount of securities lending cash collateral invested,
which resulted from an expansion of the program. In addition, the Company invested income generated from operations and cash raised through the
issuance of GICs. These items were partially offset by lower income resulting from lower market rates and the June 2002 acquisition of Hidalgo. In
addition, the 2003 period had less proceeds from sales of equity securities and real estate to use in investing activities. The 2002 period included
proceeds from a significant sale of equity securities and cash generated by the Company’s real estate sales program.
Net cash provided by financing activities was $5,322 million and $12,068 million for the years ended December 31, 2004 and 2003, respectively.
The $6,746 million decrease in net cash provided by financing activities in 2004 over the comparable 2003 period is primarily due to repayments of
short-term debt associated with dollar roll activity, and an increase in cash used in the Company’s stock repurchase program. In addition, net cash
provided by policyholder account balances decreased for the comparable 2003 period mainly as a result of a decrease in GICs sold in 2004 as
compared to 2003. The 2003 period included payments of $1,006 million received on the settlement of common stock purchase contracts (see ‘‘— The
Holding Company — Liquidity Sources — Global Funding Sources’’), and $317 million net cash proceeds associated with RGA’s issuance of common
stock. The Company also doubled its annual dividend per share in 2004. These items were partially offset by additional proceeds from the issuance of
senior notes by the Holding Company and a decrease in repayments of long-term debt for the comparable periods.
Net cash provided by financing activities was $12,068 million and $6,883 million for the years ended December 31, 2003 and 2002, respectively.
The $5,185 million increase in net cash provided by financing activities in 2003 over the comparable 2002 period is due to an increase in policyholder
account balances primarily from sales of annuity products, as well as additional short-term debt issued related to dollar roll activity. In 2003, the Company
received $1,006 million on the settlement of common stock purchase contracts (see ‘‘— The Holding Company — Liquidity Sources — Global Funding
Sources’’), issued $700 million of senior notes and had a decrease in cash used in the stock repurchase program as compared to 2002. The 2003
period also includes $317 million net cash proceeds associated with RGA’s issuance of common stock. These cash flows were partially offset by
additional repayments of long-term debt and a 10% increase in cash dividends per share in 2003 as compared to 2002.
The Holding Company
Capital
Restrictions and Limitations on Bank Holding Companies and Financial Holding Companies — Capital. MetLife, Inc. and its insured depository
institution subsidiary, MetLife Bank, are subject to risk-based and leverage capital guidelines issued by the federal banking regulatory agencies for banks
and financial holding companies. The federal banking regulatory agencies are required by law to take specific prompt corrective actions with respect to
institutions that do not meet minimum capital standards. At December 31, 2004, MetLife, Inc. and MetLife Bank were in compliance with the
aforementioned guidelines.
MetLife, Inc. 21