MetLife 2004 Annual Report Download - page 11
Download and view the complete annual report
Please find page 11 of the 2004 MetLife annual report below. You can navigate through the pages in the report by either clicking on the pages listed below, or by using the keyword search tool below to find specific information within the annual report.-
 1
1 -
 2
2 -
 3
3 -
 4
4 -
 5
5 -
 6
6 -
 7
7 -
 8
8 -
 9
9 -
 10
10 -
 11
11 -
 12
12 -
 13
13 -
 14
14 -
 15
15 -
 16
16 -
 17
17 -
 18
18 -
 19
19 -
 20
20 -
 21
21 -
 22
22 -
23
-
24
-
25
-
26
-
27
-
28
-
29
-
30
-
31
-
32
-
33
-
34
-
35
-
36
-
37
-
38
-
39
-
40
-
41
-
42
-
43
-
44
-
45
-
46
-
47
-
48
-
49
-
50
-
51
-
52
-
53
-
54
-
55
-
56
-
57
-
58
-
59
-
60
-
61
-
62
-
63
-
64
-
65
-
66
-
67
-
68
-
69
-
70
-
71
-
72
-
73
-
74
-
75
-
76
-
77
-
78
-
79
-
80
-
81
-
82
-
83
-
84
-
85
-
86
-
87
-
88
-
89
-
90
-
91
-
92
-
93
-
94
-
95
-
96
-
97
-
98
-
99
-
100
-
101
 |
 |
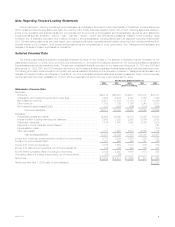
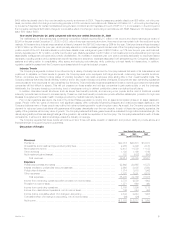
Year ended December 31, 2004 compared with the year ended December 31, 2003 — The Company
Income from continuing operations increased by $809 million, or 43%, to $2,708 million for the year ended December 31, 2004 from $1,899 million
in the comparable 2003 period. Income from continuing operations for the years ended December 31, 2004 and 2003 includes the impact of certain
transactions or events, the timing, nature and amount of which are generally unpredictable. These transactions are described in each applicable
segment’s discussion below. These items contributed a benefit of $113 million, net of income taxes, to the year ended December 31, 2004 and a benefit
of $159 million, net of income taxes, to the comparable 2003 period. Excluding the impact of these items, income from continuing operations increased
by $855 million for the year ended December 31, 2004 compared to the prior 2003 period. This increase is primarily the result of an improvement in net
investment gains (losses), net of income taxes, of $485 million. Also contributing to the increase is higher earnings from interest rate spreads of
approximately $302 million, net of income taxes, in the Institutional and Individual segments. Additionally, the Individual segment contributed $154 million,
net of income taxes, as a result of increased income from policy fees on investment-type products partially offset by higher amortization associated with
DAC of $74 million, net of income taxes, and a reduction in earnings of $78 million, net of income taxes, resulting from an increase in the closed block
policyholder dividend obligation. In addition, the Auto & Home segment’s earnings increased primarily due to an improved non-catastrophe combined
ratio and favorable claim development related to prior accident years of $113 million, net of income taxes. This increase was partially offset by higher
catastrophe losses of $73 million, net of income taxes.
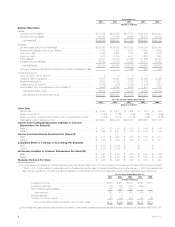
Premiums, fees and other revenues increased by $2,046 million, or 8%, to $26,414 million for the year ended December 31, 2004 from
$24,368 million from the comparable 2003 period. The Institutional segment contributed 55% to the year over year increase. This increase stems largely
from sales growth and the acquisitions of new businesses in the group life and the non-medical health & other businesses, as well as an increase in
structured settlements sales and pension close outs. The Reinsurance segment contributed approximately 35% to the Company’s year over year
increase in premium, fees and other revenues. This growth is primarily attributable to this segment’s coinsurance agreement with Allianz Life and
continued growth in its traditional life reinsurance operations. The Individual segment contributed 5% to the year over year increase primarily due to higher
fee income, partially offset by a reduction in the Company’s closed block premiums as the business continues to run-off.
Interest rate spreads, which generally represent the margin between net investment income and interest credited to policyholder account balances,
increased across the Institutional and Individual segments during the year ended December 31, 2004 compared to the prior year period. Earnings from
interest rate spreads are influenced by several factors, including business growth, movement in interest rates, and certain investment and investment-
related transactions, such as corporate joint venture income and bond and commercial mortgage prepayment fees for which the timing and amount are
generally unpredictable, and, as a result, can fluctuate from period to period. If interest rates remain low, it could result in compression of the Company’s
interest rate spreads on several of its products, which provide guaranteed minimum rates of return to policyholders. This compression could adversely
impact the Company’s future financial results.
Underwriting results in the Institutional and Individual segments in the year ended December 31, 2004 were less favorable compared to the 2003
period. Underwriting results are significantly influenced by mortality and morbidity trends, claim experience and the reinsurance activity related to certain
blocks of business, and, as a result, can fluctuate from period to period. Underwriting results in the Auto & Home segment were favorable in 2004 as the
combined ratio declined to 90.4%, excluding catastrophes, from 97.1% in the prior year period. This result is largely due to continued improvement in
both auto and homeowner claim frequencies, lower auto severities and an increase in average earned premiums.
Other expenses increased by $670 million, or 9%, to $7,761 million for the year ended December 31, 2004 from $7,091 million for the comparable
2003 period. The 2004 period reflects a $49 million reduction of a premium tax liability and a $22 million reduction of a liability for interest associated with
the resolution of all issues relating to the Internal Revenue Service’s audit of Metropolitan Life’s and its subsidiaries’ tax returns for the years 1997-1999.
These decreases were partially offset by a $50 million contribution of appreciated stock to the MetLife Foundation. The 2003 period includes the impact
of a $144 million reduction of a previously established liability related to the Company’s race-conscious underwriting settlement. In addition, the 2003
period includes a $48 million charge related to certain improperly deferred expenses at New England Financial and a $45 million charge related to VOBA
associated with a change in reserve methodology in the Company’s International segment. Excluding the impact of these transactions, other expenses
increased by $640 million, or 9%, from the comparable 2003 period. The Reinsurance segment contributed 35% to this year over year variance primarily
due to the growth in expenses with Allianz Life and continued revenue growth, as mentioned above. In addition, 27% of this variance is primarily
attributable to increases in direct business support expenses and non-deferrable commission expenses associated with general business growth, as
well as infrastructure improvements, partially offset by costs in 2003 associated with office consolidations and an impairment of assets in the Institutional
segment. The Individual segment contributed 22% to this increase primarily due to accelerated DAC amortization, as well as an increase in expenses
associated with general business growth. The remainder of the increase is the result of general business growth across the remaining segments and
Corporate & Other.
Net investment gains (losses) increased by $764 million, or 131%, to a net investment gain of $182 million for the year ended December 31, 2004
from a net investment loss of ($582) million for the comparable 2003 period. This increase is primarily due to the more favorable economic environment in
2004.
Income tax expense for the year ended December 31, 2004 was $1,071 million, or 28% of income from continuing operations before provision for
income taxes, compared with $660 million, or 26%, for the comparable 2003 period. The 2004 effective tax rate differs from the corporate tax rate of
35% primarily due to the impact of non-taxable investment income, tax credits for investments in low income housing, a decrease in the deferred tax
valuation allowance to recognize the effect of certain foreign net operating loss carryforwards in South Korea, and the contribution of appreciated stock to
the MetLife Foundation. In addition, the 2004 effective tax rate reflects an adjustment of $91 million for the resolution of all issues relating to the Internal
Revenue Service’s audit of Metropolitan Life’s and its subsidiaries’ tax returns for the years 1997-1999. Also, the 2004 effective tax rate reflects an
adjustment of $9 million consisting primarily of a revision in the estimate of income taxes for 2003. The 2003 effective tax rate differs from the corporate
tax rate of 35% primarily due to the impact of non-taxable investment income, tax credits for investments in low income housing, and tax benefits related
to the sale of foreign subsidiaries. In addition, the 2003 effective tax rate reflects an adjustment of $36 million consisting primarily of a revision in the
estimate of income taxes for 2002.
The income from discontinued operations is comprised of the operations of SSRM and net investment income and net investment gains related to
real estate properties that the Company has classified as available-for-sale. The Company entered into an agreement to sell SSRM during the third
quarter of 2004. As previously discussed, SSRM was sold effective January 31, 2005.
Income from discontinued operations, net of income taxes, decreased $208 million, or 60%, to $136 million for the year ended December 31, 2004
from $344 million for the comparable 2003 period. The decrease is primarily due to lower recognized net investment gains from real estate properties
MetLife, Inc.
8