MetLife 2004 Annual Report Download - page 17
Download and view the complete annual report
Please find page 17 of the 2004 MetLife annual report below. You can navigate through the pages in the report by either clicking on the pages listed below, or by using the keyword search tool below to find specific information within the annual report.-
 1
1 -
2
-
3
-
4
-
5
-
6
-
 7
7 -
 8
8 -
 9
9 -
 10
10 -
 11
11 -
 12
12 -
 13
13 -
 14
14 -
 15
15 -
 16
16 -
 17
17 -
 18
18 -
 19
19 -
 20
20 -
 21
21 -
 22
22 -
 23
23 -
 24
24 -
 25
25 -
 26
26 -
 27
27 -
28
-
29
-
30
-
31
-
32
-
33
-
34
-
35
-
36
-
37
-
38
-
39
-
40
-
41
-
42
-
43
-
44
-
45
-
46
-
47
-
48
-
49
-
50
-
51
-
52
-
53
-
54
-
55
-
56
-
57
-
58
-
59
-
60
-
61
-
62
-
63
-
64
-
65
-
66
-
67
-
68
-
69
-
70
-
71
-
72
-
73
-
74
-
75
-
76
-
77
-
78
-
79
-
80
-
81
-
82
-
83
-
84
-
85
-
86
-
87
-
88
-
89
-
90
-
91
-
92
-
93
-
94
-
95
-
96
-
97
-
98
-
99
-
100
-
101
 |
 |

automobile and homeowner’s claim frequencies. These favorable changes in expenses are partially offset by an increase in losses from catastrophes of
$112 million and a $39 million increase in expenses primarily due to inflation and employee and other related labor costs. The combined ratio excluding
catastrophes declined to 90.4% for the year ended December 31, 2004 from 97.1% for the comparable 2003 period.
Year ended December 31, 2003 compared with the year ended December 31, 2002 — Auto & Home
Net income increased by $25 million, or 19%, to $157 million for the year ended December 31, 2003 from $132 million for the comparable 2002
period. The increase in earnings year over year is mainly due to premium growth, lower investment losses and a reduction in expenses, partially offset by
adverse claims development.
Total revenues, excluding net investment gains and losses, increased by $67 million, or 2%, to $3,098 million for the year ended December 31,
2003 from $3,031 million for the comparable 2002 period. This variance is mainly due to increases in the average earned premium due to rate increases,
partially offset by lower investment income primarily resulting from the change in capital allocation methodology.
Total expenses increased by $84 million, or 3%, to $2,896 million for the year ended December 31, 2003 from $2,812 million for the comparable
2002 period. Adverse claims development related to prior accident years, resulting mostly from bodily injury and uninsured motorists claims, accounted
for $46 million of the increase in policyholder benefits. Also contributing to this increase are higher catastrophe losses of $22 million. Partially offsetting
these increases are improved non-catastrophe homeowner’s claims frequencies, a reduction in the number of auto and homeowner’s policies in-force,
and underwriting and agency management actions. In addition, there was a $23 million reduction in expenses resulting from the completion of the St.
Paul integration and a $35 million reduction in the cost associated with the New York assigned risk plan. The combined ratio, excluding catastrophes,
which represents losses and total expenses including claims as a percentage of premiums, declined to 97.1% for the year ended December 31, 2003
versus 97.4% for the comparable 2002 period.
International
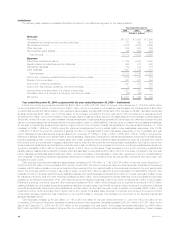
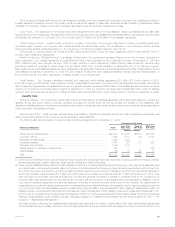
The following table presents consolidated financial information for the International segment for the years indicated:
Year Ended December 31,
2004 2003 2002
(Dollars in millions)
Revenues
Premiums *************************************************************************** $1,735 $1,678 $1,511
Universal life and investment-type product policy fees ************************************** 350 272 144
Net investment income **************************************************************** 585 502 461
Other revenues ********************************************************************** 23 80 14
Net investment gains (losses) ********************************************************** 23 8 (9)
Total revenues ******************************************************************* 2,716 2,540 2,121
Expenses
Policyholder benefits and claims ******************************************************** 1,614 1,457 1,388
Interest credited to policyholder account balances ***************************************** 152 143 79
Policyholder dividends***************************************************************** 47 55 35
Other expenses ********************************************************************** 624 660 507
Total expenses******************************************************************* 2,437 2,315 2,009
Income from continuing operations before provision for income taxes ************************* 279 225 112
Provision for income taxes ************************************************************* 86 17 28
Income from continuing operations before cumulative effect of a change in accounting ********** 193 208 84
Cumulative effect of a change in accounting, net of income taxes **************************** (30) — —
Net income ************************************************************************* $ 163 $ 208 $ 84
Year ended December 31, 2004 compared with the year ended December 31, 2003 — International
Income from continuing operations decreased by $15 million, or 7%, to $193 million for the year ended December 31, 2004 from $208 million for
the comparable 2003 period. The prior year includes a $62 million benefit, net of income taxes, from the merger of the Mexican operations and a
reduction in policyholder liabilities resulting from a change in reserve methodology, a $12 million tax benefit in Chile related to the merger of two
subsidiaries and an $8 million benefit, net of income taxes, related to reinsurance treaties. These increases are partially offset by a $19 million charge, net
of income taxes, in Taiwan related to an increased loss recognition reserve due to low interest rates relative to product guarantees. The prior year also
includes a $4 million benefit, net of income taxes, related to the Spanish operations, which were sold in 2003. Excluding these items, income from
continuing operations increased by $52 million or 37%. A significant component of this increase is attributable to the application of SOP 03-1 in the
current year, which resulted in a $21 million decrease, net of income taxes, in policyholder liabilities in Mexico. The primary driver of the current year
impact is a decline in the fair value of the underlying assets associated with these contracts. Additionally, a $10 million, net of income taxes, increase in
net investment gains is primarily due to the gain from the sale of the Spanish operations. In addition, 2004 includes $8 million of certain tax-related
benefits in South Korea. The remainder of the increase can be attributed to business growth in other countries.
Total revenues, excluding net investment gains (losses), increased by $161 million, or 6%, to $2,693 million for the year ended December 31, 2004
from $2,532 million for the comparable 2003 period. The prior year period includes $230 million of revenues related to the Spanish operations, which
were sold in 2003. Excluding the sale of these operations, revenues increased by $391 million, or 17%. The Company’s Mexican and Chilean operations
increased revenues by $144 million and $58 million, respectively, primarily due to growth in the business, as well as improved investment earnings. The
Company’s operations in South Korea and Taiwan also have increased revenues by $121 million and $34 million, respectively, primarily due to increased
new sales and renewal business. Changes in foreign currency exchange rates contributed $14 million to the year over year increase in revenues. The
remainder of the increase can be attributed to business growth in other countries.
Total expenses increased by $122 million, or 5%, to $2,437 million for the year ended December 31, 2004 from $2,315 million for the comparable
2003 period. The prior year includes expenses of $223 million related to the Spanish operations, which were sold in 2003. The prior year also includes a
MetLife, Inc.
14