MetLife 2004 Annual Report Download - page 37
Download and view the complete annual report
Please find page 37 of the 2004 MetLife annual report below. You can navigate through the pages in the report by either clicking on the pages listed below, or by using the keyword search tool below to find specific information within the annual report.-
 1
1 -
2
-
3
-
4
-
5
-
6
-
7
-
8
-
9
-
10
-
11
-
12
-
13
-
14
-
15
-
16
-
17
-
18
-
19
-
20
-
21
-
22
-
23
-
24
-
25
-
26
-
 27
27 -
 28
28 -
 29
29 -
 30
30 -
 31
31 -
 32
32 -
 33
33 -
 34
34 -
 35
35 -
 36
36 -
 37
37 -
 38
38 -
 39
39 -
 40
40 -
 41
41 -
 42
42 -
 43
43 -
 44
44 -
 45
45 -
 46
46 -
 47
47 -
48
-
49
-
50
-
51
-
52
-
53
-
54
-
55
-
56
-
57
-
58
-
59
-
60
-
61
-
62
-
63
-
64
-
65
-
66
-
67
-
68
-
69
-
70
-
71
-
72
-
73
-
74
-
75
-
76
-
77
-
78
-
79
-
80
-
81
-
82
-
83
-
84
-
85
-
86
-
87
-
88
-
89
-
90
-
91
-
92
-
93
-
94
-
95
-
96
-
97
-
98
-
99
-
100
-
101
 |
 |

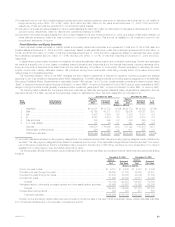
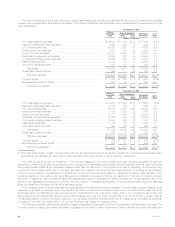
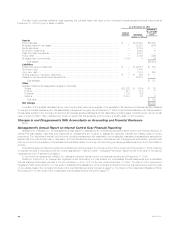
The following table presents the amortized cost and valuation allowance for commercial mortgage loans distributed by loan classification at:
December 31, 2004 December 31, 2003
% of % of
Amortized % of Valuation Amortized Amortized % of Valuation Amortized
Cost(1) Total Allowance Cost Cost(1) Total Allowance Cost
(Dollars in millions)
Performing ******************************************** $25,077 99.8% $128 0.5% $20,315 99.5% $ 95 0.5%
Restructured******************************************* 55 0.2 18 32.7% 77 0.4 23 29.9%
Potentially delinquent************************************ 7 — 3 42.9% 30 0.1 4 13.3%
Delinquent or under foreclosure*************************** —— — —— —
Total ***************************************** $25,139 100.0% $149 0.6% $20,422 100.0% $122 0.6%
(1) Amortized cost is equal to carrying value before valuation allowances.
The following table presents the changes in valuation allowances for commercial mortgage loans for the:
Years Ended December 31,
2004 2003 2002
(Dollars in millions)
Balance, beginning of year ********************************************************************** $122 $119 $134
Additions ************************************************************************************* 53 51 38
Deductions *********************************************************************************** (26) (48) (53)
Balance, end of year *************************************************************************** $149 $122 $119
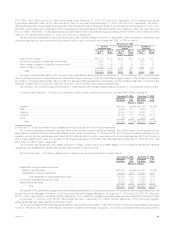
Agricultural Mortgage Loans. The Company diversifies its agricultural mortgage loans by both geographic region and product type.
Approximately 69% of the $5,907 million of agricultural mortgage loans outstanding at December 31, 2004 were subject to rate resets prior to
maturity. A substantial portion of these loans generally is successfully renegotiated and remain outstanding to maturity. The process and policies for
monitoring the agricultural mortgage loans and classifying them by performance status are generally the same as those for the commercial loans.
The following table presents the amortized cost and valuation allowances for agricultural mortgage loans distributed by loan classification at:
December 31, 2004 December 31, 2003
% of % of
Amortized % of Valuation Amortized Amortized % of Valuation Amortized
Cost(1) Total Allowance Cost Cost(1) Total Allowance Cost
(Dollars in millions)
Performing ******************************************** $5,803 98.1% $ 4 0.1% $5,162 96.7% $ — 0.0%
Restructured******************************************* 67 1.1 — 0.0% 111 2.1 1 0.9%
Potentially delinquent************************************ 4 0.1 1 25.0% 24 0.5 3 12.5%
Delinquent or under foreclosure*************************** 40 0.7 2 5.0% 36 0.7 2 5.6%
Total ***************************************** $5,914 100.0% $ 7 0.1% $5,333 100.0% $ 6 0.1%
(1) Amortized cost is equal to carrying value before valuation allowances.
The following table presents the changes in valuation allowances for agricultural mortgage loans for the:
Years Ended December 31,
2004 2003 2002
(Dollars in millions)
Balance, beginning of year ********************************************************************** $6 $6 $9
Additions ************************************************************************************* 513
Deductions *********************************************************************************** (4) (1) (6)
Balance, end of year *************************************************************************** $7 $6 $6
Other Loans. Other loans consist of residential mortgages and auto loans.
Real Estate and Real Estate Joint Ventures
The Company’s real estate and real estate joint venture investments consist of commercial properties located primarily throughout the United States.
At December 31, 2004 and 2003, the carrying value of the Company’s real estate, real estate joint ventures and real estate held-for-sale was
$4,233 million and $4,677 million, respectively, or 1.8%, and 2.1% of total cash and invested assets, respectively. The carrying value of real estate is
stated at depreciated cost net of impairments and valuation allowances. The carrying value of real estate joint ventures is stated at the Company’s equity
MetLife, Inc.
34